.jpeg)


Making critical decisions with incomplete information is one of the most difficult challenges for any growing company. In today's market, relying on your gut or struggling with outdated spreadsheets is like trying to navigate a storm without a compass. That's precisely where business analytics software comes in-not just as a tool, but as a strategic partner. It translates your complex data into a clear and reliable map for your future journey.
Think of it as an expert navigator for your business. It doesn't just show you where you've been, it helps you chart a course in unstable conditions. And modern AI-based systems like Electe, an AI-based data analytics platform for SMBs, go beyond just historical reports. They provide predictive forecasts and one-click insights, putting enterprise-level analytics at your fingertips, even if you don't have a dedicated data science team. This guide will walk you through the key features, tangible benefits, and key steps to select a platform that truly promotes measurable growth.
The main mission of any business analytics platform is to eliminate background noise. Instead of drowning in separate spreadsheets related to sales, marketing and operations, you get a single, unified view of the entire business. This clarity enables you to spot trends, identify opportunities, and anticipate potential problems before they become serious.
This is not just a trend, but a fundamental change in the way companies operate. The global market for business analytics software is growing at a staggering rate, with North America alone accounting for about 55 percent of total revenue. This boom is fueled by companies relying on data for their strategies, the rise of cloud solutions, and huge advances in artificial intelligence. You can read the full research on the booming market to get a better idea of its trajectory.
A key function of these platforms is to transform raw data into intuitive dashboards. An effective dashboard displays your most important key performance indicators (KPIs) in one place, making it easy to see what is happening at a glance.

With a visual summary like this, a manager can immediately assess campaign results, customer acquisition costs, and traffic sources without having to dig through complex data files. It highlights what is working and where improvements are needed, paving the way for faster, more informed decision making.
By consolidating and visualizing data, business analysis software eliminates guesswork. It replaces ambiguity with hard evidence, allowing you to develop strategies based on what the data actually say, not what you think they might say.
Ultimately, the right business analytics software democratizes data throughout the organization. It enables everyone from the marketing team to executives to contribute to a smarter, more agile and profitable business.
Choosing the right business analytics software can seem like a daunting task, especially when every platform seems to promise mountains and seas. To get real value, you need to look beyond the marketing noise and get to the heart of what these platforms actually do. Functionality is the engine that turns raw data into your next big strategic move.
The entire path from a messy spreadsheet to a clear decision starts with a solid foundation. First, any platform worth considering must connect to all your different data sources (CRM, website analytics, accounting software) and bring everything together in one place. If it cannot do this, you will simply end up with a prettier version of the same old fragmented data.
Once all your data is in one place, the platform needs to make it understandable. That's where interactive dashboards and automated reporting come in. Imagine no longer having to waste hours manually extracting reports. Instead, your team gets real-time visuals that report what's important, right then and there.
Before you get dazzled by artificial intelligence and machine learning, make sure that whatever platform you are considering has mastered the basics. These are indispensable elements, the absolute foundation of effective data analysis.
These core capabilities give you the visibility you need to make smart daily decisions. They answer the fundamental question, "What is happening in my company right now?"
Knowing what is happening now is critical, but what is really a game changer is knowing what will happen next. This is where modern AI-based business analysis software stands out from the crowd, moving from simply describing the past to predicting and defining the future.
A data analysis platform based on artificial intelligence doesn't just show you the numbers; it explains what they mean and what you should do next. It's like having a data scientist on your team, available 24/7.
These advanced features are what turn a basic reporting tool into a strategic partner. They help you answer the hard, forward-looking questions, "What could happen next?" and "What is the best move we can make?"
As you evaluate different platforms, pay attention to these artificial intelligence-based features. This is where you will find a serious return on your investment.
By creating a checklist that starts with the basic must-have features and then moves on to these powerful AI-based features, you can systematically find the perfect platform for your business. This way you not only solve today's problems, but also prepare for tomorrow's opportunities.
The real magic of business analytics software is not in the list of features, but in what happens when you see it in action. The real value comes from solving specific, tangible problems, whether it's a local store trying to understand its customers or a global financial company managing risk. Data analytics provides the clarity needed for smarter and faster decision making.
This is not just a niche trend, but a huge change. The business analytics market in North America has grown to an estimated $253 billion, with a steady growth rate of 12.8 percent per year over the past five years. This growth is fueled by companies in every imaginable industry, all seeking a competitive advantage. You can learn more about the key factors driving this market expansion from IBISWorld.
Let's look at some real-world examples of how different industries are turning raw data into a serious competitive advantage.
Retail is a world of razor-thin margins and unstable customer loyalty. One wrong decision on inventory, pricing or promotions can determine the success or failure of the season.
In the world of finance, managing risk and ensuring compliance is not only important, it is critical. Business analytics gives companies the power to monitor millions of transactions and detect potential threats as soon as they occur.
Business analysis transforms compliance from a reactive and bureaucratic task to a proactive and intelligent defense that protects both the institution and its customers.
Small and medium-sized enterprises (SMEs) often feel as if they are playing a different game, outclassed by the huge data resources of large companies. But modern artificial intelligence-based platforms are leveling the playing field, making powerful analytics tools accessible and affordable.
Choosing the right business analytics software may seem like a defining moment, but it need not be daunting. The key is to look beyond lists of catchy features and focus on what your business really needs, both on a day-to-day basis and in the long run. A solid checklist helps you gain clarity.
Let's be honest: the most powerful platform on the planet is useless if your team doesn't know how to use it. For SMEs in particular, where dedicated data analysts are a luxury, ease of use is not just an optional extra; it's everything. You need an intuitive interface and one-click reports that enable your marketing manager or operations manager to find the answers without needing a PhD in data science.
This decision tree shows how different sectors, such as retail, finance and SMEs, tend to prioritize different analytical capabilities according to their main challenges.
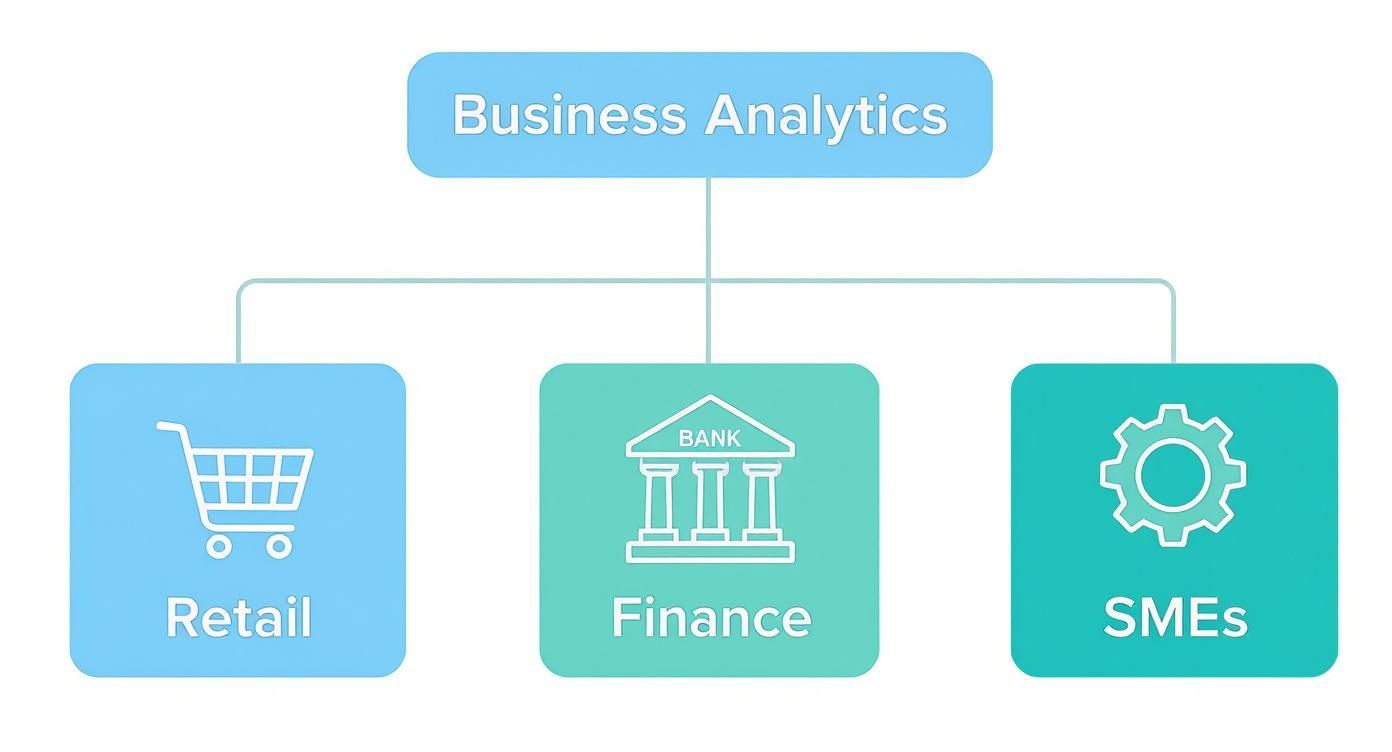
Although the end goals may seem different, the basic need for clear and accessible data is the common thread that unites them all.
As you begin comparing different options, keep these basic criteria in mind. Each is a key piece of the puzzle to ensure that the platform you choose becomes a strategic asset, not just another complicated piece of software.
It is easy to confuse these terms, but they serve very different purposes. This table outlines the key differences to help you understand where business analysis fits in and why it is often the right starting point for most companies.
Platform type Main objective Typical user MainfocusBusiness analysisDiagnosing why certain things happened and predicting what will happen in the future. Business managers, operations managers, marketers Statistical analysis, predictive modeling, forecasting.Business Intelligence (BI)Describe what has happened in the past. Executives, analysts Dashboards, reporting, data visualization (historical view).Data ScienceBuildcomplex models to answer new and open questions. Data scientists, researchers Machine learning, advanced algorithms, large-scale data mining.
Basically, the BI tells you that sales are down 10 percent. Business analytics tells you that this is due to a decline in a specific region and predicts the trend for the next quarter. Data science creates a new algorithm to predict customer churn from scratch. For most SMEs, business analytics is the ideal balance between useful and forward-looking information.
Of course, budget is always an important factor, but list price rarely tells the whole story. You need to understand the pricing structure and, more importantly, how to relate it back to the real return on investment (ROI).
Think of it this way: you are not simply buying software. You are investing in better, faster, smarter decisions. ROI comes from the time you save, the opportunities you discover, and the costly mistakes you avoid.
You will generally come across a couple of common price models:
To understand your potential ROI, look at both the concrete numbers and the less tangible benefits. Calculate the hours your team will save by automating manual reports. Put a numerical value on the potential increase in revenue from identifying a new market trend or optimizing a sales funnel. These concrete figures will make a compelling argument for investing in business analytics software that provides enterprise-level information without the enterprise-level price tag.
Choosing the right business analytics software is a critical step, but it is only the first step. The real magic happens during implementation: that's where a smart plan turns a powerful platform into tangible business results. It is natural to feel a little hesitant at this stage, worried about complexity or disruption, but modern platforms are designed to make this process surprisingly smooth.
Successful implementation is not about flipping a switch and changing everything overnight. Rather, it is about building momentum. You can start with a targeted pilot project, perhaps for a single department or to address a specific challenge. This approach will get you some initial results, creating enthusiasm and making it much easier to get everyone else on board.
Before even thinking about deployment, it is absolutely critical to lay the groundwork. This groundwork ensures that your team and your data are ready, enabling you to get the most out of the platform from day one.
Taking these initial steps transforms implementation from a purely technical task to a strategic one, aligning and focusing the entire team. This focus is the secret to building a culture in which data-driven decision making simply becomes the way of working.
Good implementation is not only about technology, but also about a change in mindset. The ultimate goal is to enable each individual team member to ask questions and find their own answers using data, making it a natural part of their daily routine.
The best business analytics platform is one that people actually use. Promoting adoption means making data accessible and relevant to everyone's work, turning simple curiosity into powerful business insights.
To achieve this goal, ongoing training and open communication are indispensable. Regular sessions can be held to showcase new features and, more importantly, share success stories from across the company. When the sales team sees how marketing has used the platform to find a gold mine of new leads, you can bet they will be lining up to see what it can do for them.
This is where modern cloud-based platforms like Electe are at their best. They are designed for rapid deployment and are really easy to use, helping you go from raw data to useful information in minutes rather than months. This creates a seamless transition that fuels curiosity and gets everyone using the platform from the start.
The world of business analytics software is not only evolving, it is undergoing a fundamental shift. We are moving from simply asking "what happened?" to actively predicting and shaping "what will happen next." This huge shift is driven almost entirely by artificial intelligence and machine learning, which are transforming analytics from a reactive reporting tool to a proactive and strategic partner.
Think of it this way: traditional analysis was like driving using only the rearview mirror. You could see where you had been, but not where you were going. The future is about having an intelligent GPS that not only maps the road ahead, but also suggests the best routes to take based on real-time conditions. This is a quantum leap from simply looking at historical data to generating powerful predictive and prescriptive insights.
The market is already voting with its wallet. The data and analytics software market in the United States, currently valued at about $41.7 billion, is on track to reach $47.5 billion. Much of this growth comes from artificial intelligence-based platforms that help companies look beyond, anticipate market changes and outpace competitors.
Two key innovations are making this future a reality, especially for SMEs. These are not just trendy words, but technologies that break down the old barriers that confined advanced analytics to the data science labs of large companies.
AI is a great equalizer. It gives SMEs access to sophisticated, forward-looking information that used to be the exclusive preserve of large companies. It is about making smarter, data-driven decision making accessible to all.
These technologies are not a distant dream; they are already built into modern business analysis software. They allow you to go beyond just displaying numbers on a screen. You can finally understand the story behind the data and, more importantly, start writing the next chapter yourself. This is exactly what we are building into Electe: putting the power of AI-based insights directly into your hands.
Getting started with business analysis doesn't have to be complicated. Here are the most important, concrete steps you can take to move from data overload to decisive action:
In today's competitive landscape, leveraging data is no longer an option; it is essential for survival and growth. Modern business analytics software bridges the gap between raw data and effective decision making, enabling you to uncover opportunities, mitigate risks, and chart a clear path forward. By moving from historical reports to predictive information based on artificial intelligence, you can stop reacting to the market and start shaping it. The power to transform your business is already in your data; the right platform simply helps you bring it to light.

.svg)
.svg)
.svg)