Imagine having every single activity that makes up your operational flow in front of you at a glance. It's like a road map that guides you from the first to the last step, highlighting detours and traffic jams.
Today, in an increasingly competitive and digitized market, process mapping is the tool that allows you to transform uncertainty into concrete data. With a clear map, you can identify bottlenecks, reduce cycle times, and improve the quality of results.
In this guide, you will discover:
Why mapping is essential for SMEs and how it integrates with digital transformation.
Tools and methodologies (BPMN and flowcharts) for modeling effective processes.
Key KPIs for measuring performance and optimizing resources.
Real cases involving Italian SMEs and public administrations, with concrete data and results.
How to leverage predictive analytics and real-time monitoring with Electe, an AI-powered data analytics platform for SMEs.
Are you ready to make every activity more efficient and transparent? Start planning your process mapping now.
If you run an SME, you may still rely on the memory of a single person to manage orders and inventory. Without codified workflows, every unexpected event becomes a hidden cost:
A manufacturing company lost a €50k contract due to undocumented steps.
An e-commerce store discovered duplicate orders only after shipping.
An administrative office delayed monthly reports by five days.
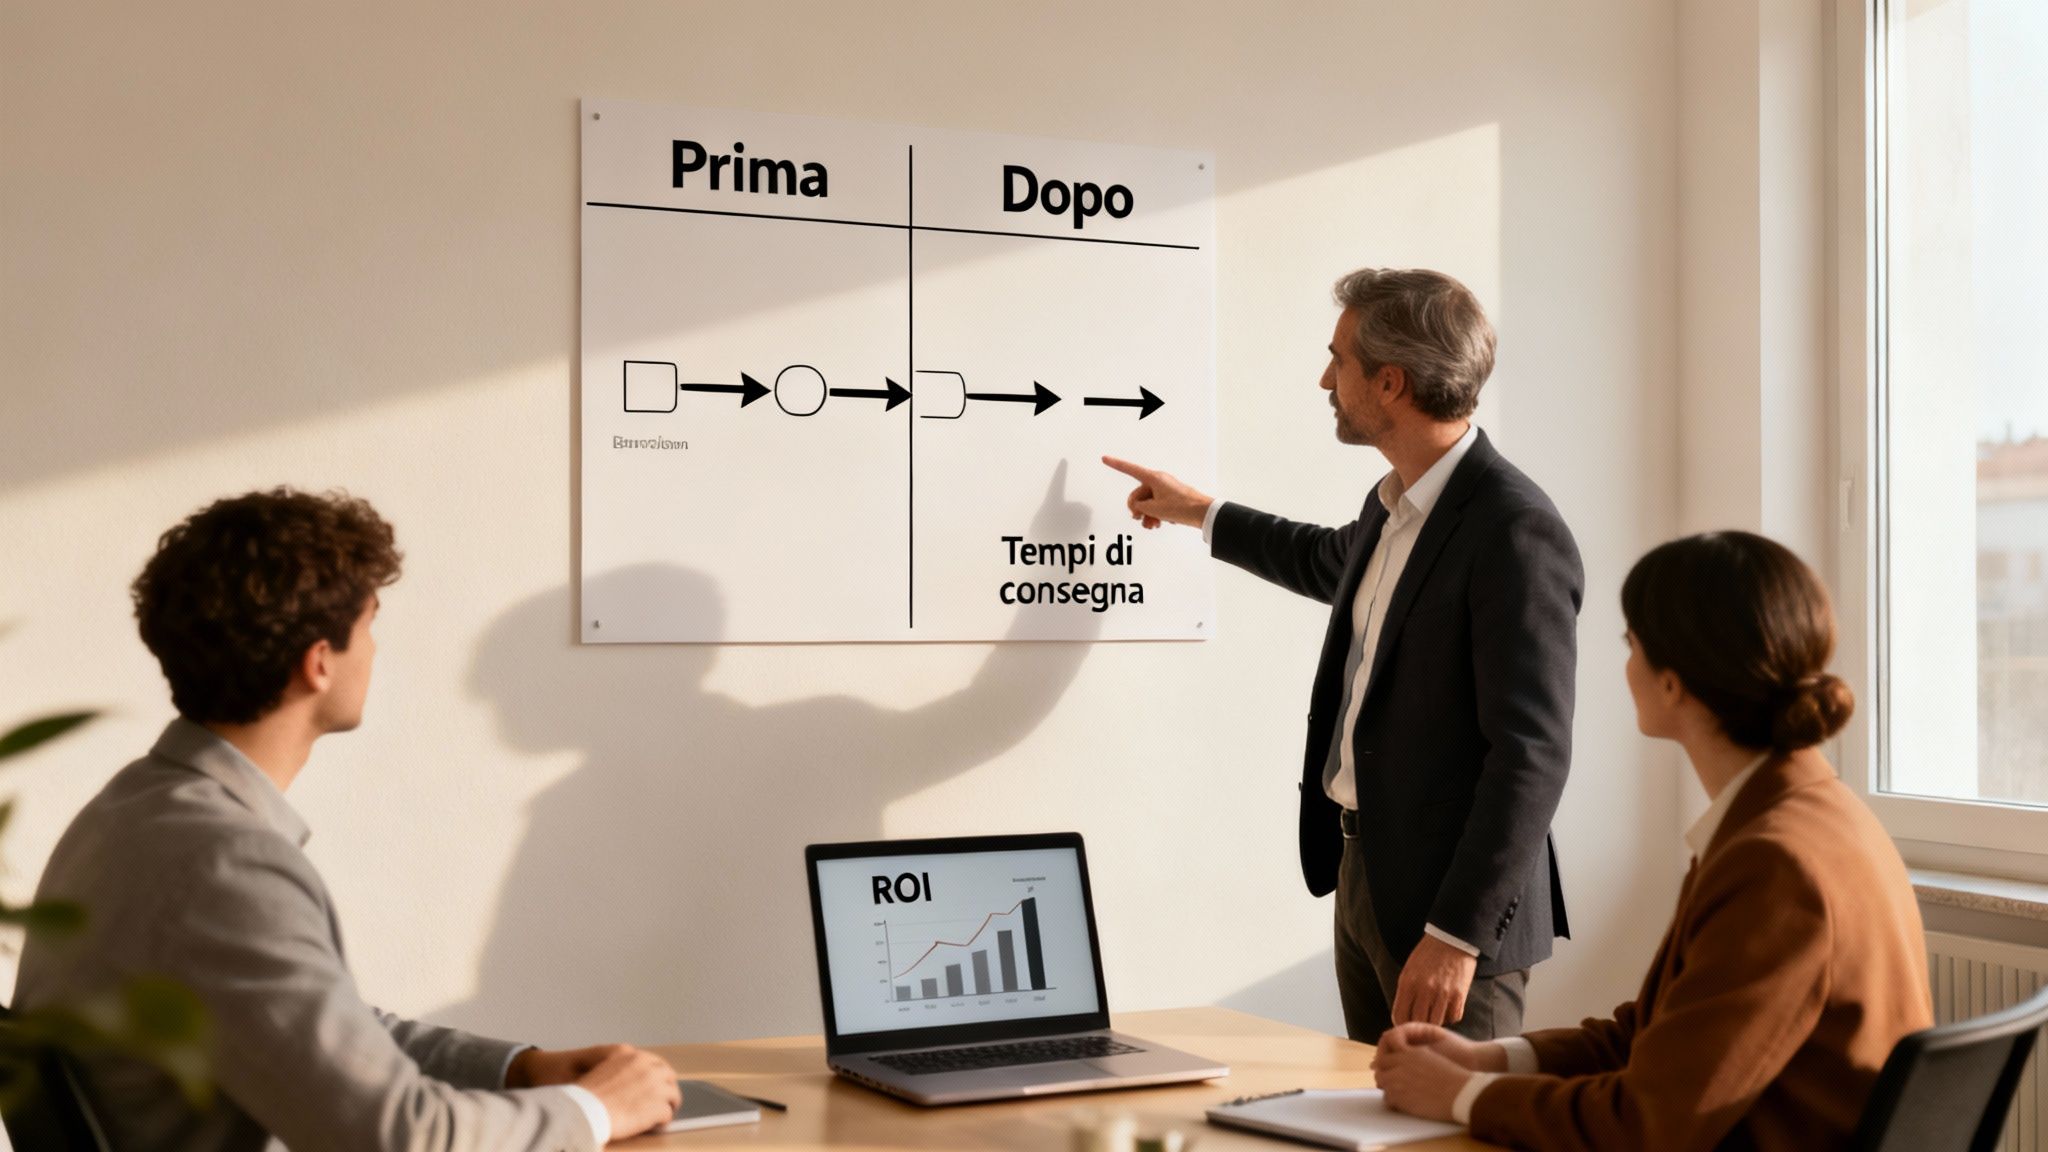
After drawing up a clear map, that company measured:
Lead time reduced by 25%
Production errors reduced by 40%
Operating savings of €20k per year
Estimated ROI of 150%
The result? More satisfied customers and faster onboarding of new hires, with a 60% reduction in training time.
When a local manufacturer spent three months manually mapping assembly processes, he discovered:
“Visibility into flows has allowed us to cut times by 30%.”
As a result, operating costs have fallen by €20k per year.
On these pages, I will guide you step by step, taking you from:
Analysis of the most effective tools
Definition of KPIs to measure cycle time and redundancies
Real cases of Italian SMEs
Tips for continuous improvement
By the end, you will know how to calculate ROI, ensure regulatory compliance, and turn mapping into a driver of growth.
Imagine an orchestra: every musician follows the same score and knows exactly when to come on stage. That's how a business process works: coordinated activities for a defined result. Clarifying the boundaries of the process avoids "discord": duplication, missing steps, or communication errors.
On the contrary, a flow lists tasks without explaining who does what and why. Identifying a real process means focusing on interactions between departments and shared responsibilities, better distributing roles and making internal collaboration more fluid.
In the process, relationships between functions and decision points are important. A flowchart, on the other hand, only illustrates the order of operations.
"A process-free flow is like a score without musicians: it lacks the context to play."

Macro map: overview of the main steps
Micro map: details of individual tasks
Find the right balance by adjusting the level of detail according to your objectives.
BPMN and flowcharts standardize visualization:
Circle: initial and final events
Rectangle: activities and subprocesses
Diamond: decisions and gateways
Swimlane: departmental responsibilities
Message flow: interaction between processes or systems
The AgID's 2024-2026 Three-Year ICT Plan stipulates that 65% of PA processes in IT-intensive areas must be digitally mapped. Objectives:
Standardize process models
Generate periodic reports
Ensuring transparency and traceability
For more information, visit the page on business process management.
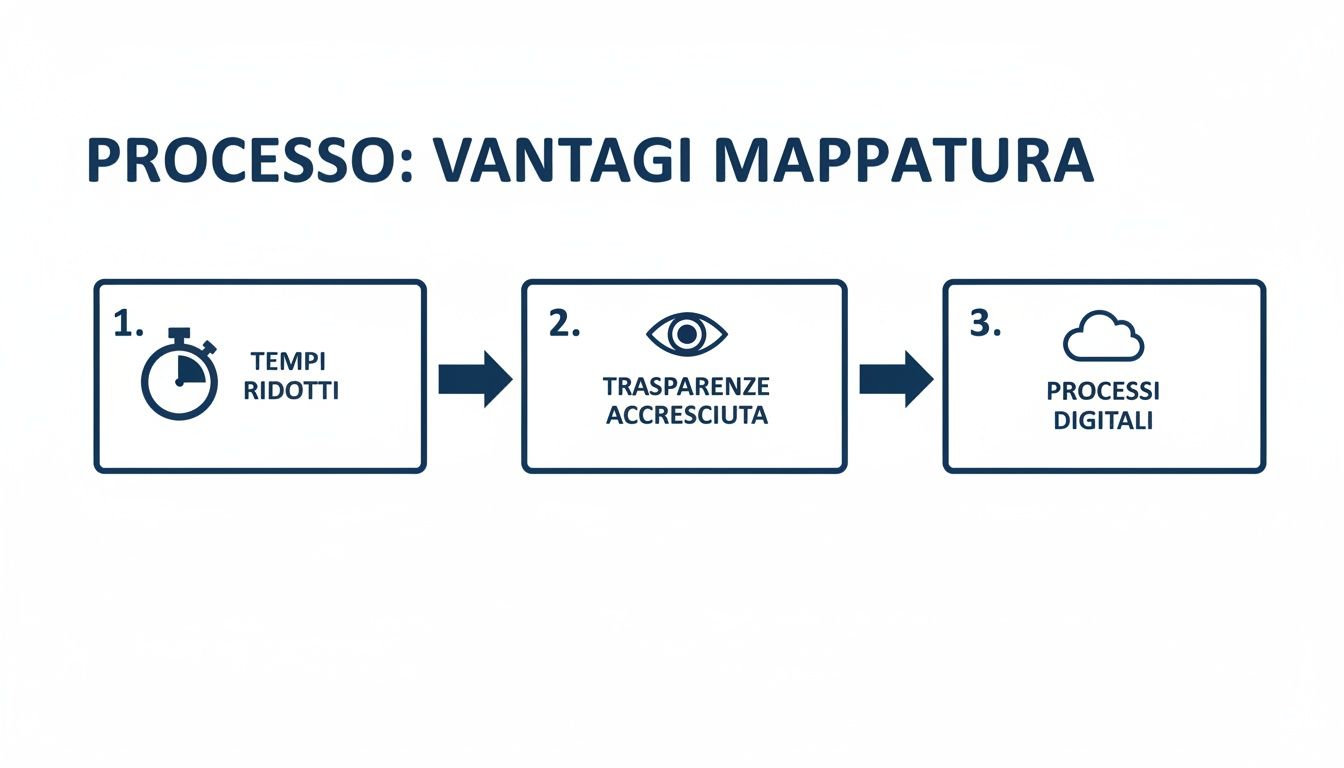
Process mapping is like an X-ray: it reveals inefficiencies and provides a clear view of time and resources. With timely measures, you can intervene before a bottleneck becomes a problem.
Cycle time: average time required to complete a process
Redundancy rate: percentage of duplicate activities
Percentage of digitized processes: share of digital flows
A municipality in Liguria has reduced administrative processing times by 40 %. According to the Digital Municipalities Map Report, 75% of municipalities have improved administrative efficiency by reducing processing times by 40% on average. Find out more about the results.
Excessive details
Failure to verify with stakeholders
No periodic review
Limit essential trips
Organize review sessions with key users
Schedule quarterly reviews
Mapping transforms internal management by optimizing time and communication.
metricaprimadopotempo cycle8 days5 daysredundancy rate15%4%digital processes40%80%
Integrating mapping with business intelligence solutions means shifting from a retrospective view to a real-time one. A dedicated platform automates collection, analysis, and reporting.
Electe a data analytics platform that supports advanced mapping. Thanks to predictive analysis, you can identify bottlenecks before they actually arise. Discover the advantages by reading the full article.
Process mapping guides you from choosing the scope to continuous updates, reducing unnecessary activities and focusing your energy on what matters.
Identify boundaries and objectives
Collecting data through interviews and workshops
Modeling flows using BPMN
Validate and update documentation
Create an overview
Highlight critical areas
Engage stakeholders right from the start
Note the average duration of each activity
Record resources and tools used
Report recurring critical issues
Search: starting and ending points
Rectangles: intermediate stages
Diamonds: crossroads and decisions
A well-designed BPMN diagram is like a navigation system: it guides you without leaving room for doubt.
Camunda: integrated simulations and automation
Draw.io: free, integrates with Google Drive
Lucidchart: real-time editing and version control
Microsoft Visio: compatible with Office and ISO standards
Share the draft with teams and managers
Collect feedback and make improvements
Schedule reviews every three months
Without regular maintenance, the map becomes an obsolete document.
The University of Ferrara observed the university's logistics flows in Emilia-Romagna. After multidisciplinary workshops and BPMN modeling:
35% improvement in performance
Times reduced by 50%
Errors reduced by 60%
Read the full study on logistics processes
"Mapping has transformed a fragmented system into a continuous and measurable flow," explains the researcher.
A municipality in the north has applied mapping to the tax office:
Processing times reduced by 40%
Complaints reduced by 30%
“A living map becomes a collaborative tool that evolves with the organization.”
A Turin-based company digitized instructions and created detailed BPMN diagrams:
Assembly time –25%
Waste –45%
Onboarding –50%
“Clarity in processes allows you to standardize activities and accelerate learning.”
With Electe automatically import process data, generate reports with a single click, and receive alerts on defined KPIs. Discover how to simplify mapping with a free demo of Electe.
Electe data from ERP, CRM, and other sources without writing a single line of code, reducing errors and duplication.
Cross-platform connections with background synchronization
Instant import via standard API
Continuous loading with detailed logs
Electe machine learning models to flag bottlenecks before they impact processes, reducing the time spent on manual reviews by up to 70%.
“Thanks to predictive analytics, bottlenecks emerge early on.”
Learn more about predictive analytics in Electe: Find out more about predictive analytics in Electe.
Continuous monitoring allows you to quantify ROI in real time. Request a free demo now and turn process mapping into a real competitive advantage.
How long does it take to produce a first draft?
Generally 2-3 weeks between operational workshops, data collection, and simplified flowcharts.
What tools should be used to model processes?
BPMN with Draw.io or Lucidchart
Flowchart in Microsoft Visio or Google Drawings
Camunda for dynamic simulations
What skills are needed and how should the team be trained?
Intensive one-day workshop on BPMN
Practical sessions with real cases
Step-by-step guides and operational checklists
How to integrate mapping with AI solutions such as Electe?
Thanks to API connectors, your diagrams are automatically transferred to the AI environment, generating detailed reports and predictive analyses.
Automation through Electe can reduce the time spent on manual analysis by 70%.
Define boundaries and goals before you begin.
Use standard symbols (BPMN/flowchart) for clarity.
Review the map with your team and update it regularly.
Monitor key KPIs: cycle time, redundancy, digitization.
Take advantage of Electe predictive analytics and real-time monitoring.
In conclusion, process mapping is key to making every operation more efficient and transparent. By defining boundaries, adopting standard symbols, and regularly validating maps, you can reduce cycle times and redundancies, improving internal quality and your customers' experience. Today, thanks to an AI-powered data analytics platform such as Electe, you can automate data collection, activate predictive analytics, and monitor KPIs in real time with custom dashboards. Don't miss the opportunity to turn processes into a competitive advantage. Request a free demo of Electe now Electe find out how to simplify your process mapping →
Electe

.svg)
.svg)
.svg)


.png)