A business intelligence software is a tool that collects, analyzes and visualizes business data to turn it into strategic decisions. Basically, it is an intelligent co-pilot that helps you make decisions no longer on instinct, but based on hard facts. On numbers that speak for themselves.
Are you drowning in a sea of data without knowing how to use it? This guide will show you how business intelligence software can turn background noise into a compass for growth, giving you the insights you need to make quick, effective, fact-based decisions.

Many SMEs find themselves overwhelmed by a flood of data. It comes from sales, marketing, operations, customers. While this data is a treasure trove, it is often fragmented among spreadsheets, CRM and other systems, making it nearly impossible to get an overview. The result? Slow decisions, missed opportunities and that unpleasant feeling of navigating blindly.
Here, a data analytics platform acts exactly as a bridge, connecting all these islands of data. It gathers the information, cleans it up, and serves it up on a silver platter in the form of interactive dashboards and easy-to-read reports. Thus, you don't have to be an analyst to understand what's going on. Just a glance is all it takes to visualize sales performance, monitor a marketing campaign, or unearth a bottleneck in production.
At one time, adopting BI tools was an expensive and complex undertaking reserved for large corporations with dedicated IT teams. Today, modern AI-powered platforms, such as Electe, have made these technologies accessible, intuitive and affordable even for SMEs. This democratization is crucial in an increasingly fierce market.
In fact, the business intelligence market in Italy is growing at a rapid pace. It is projected to expand at a compound annual growth rate (CAGR) of8.56 percent between 2025 and 2034. The value of the industry is estimated to grow from $36.79 billion to about $69.45 billion in less than a decade, driven precisely by the need to extract strategic value from data.
The purpose of this guide is just that: to show you how business intelligence software can transform your data from mere background noise to a real strategic compass. Together we will see how to turn raw data into useful information and illuminate the path to growing your business.
Modern business intelligence software is more than just a chart maker. Think of it as your company's strategic command center, the dashboard that turns complex data into clear, rapid decisions. The right functionality can make the difference between reacting to the market and anticipating it.
Let's see what key features every SME should look for in a data analytics platform to gain a real competitive advantage.
Dashboards are the beating heart of any BI platform. They need to be more than just a collection of static charts; they need to tell an interactive story about your business data, allowing you to engage with them.
An effective dashboard allows you to monitor Key Performance Indicators (KPIs) in real time, explore data with dynamic filters, and move from an overview to detailedanalysis with a single click. Imagine being able to view total sales, and then immediately, with a simple drill-down, analyze the performance of an individual product in a specific region. All in the same screen.
This image, for example, shows how a business intelligence dashboard aggregates several metrics into a single view.

Clear data visualization, as in this case, is critical to turning raw numbers into immediately understandable insights, even for less technical team members. To learn more about how to create powerful visualizations, check out our guide on how to build effective analytic dashboards on Electe.
How many hours does your team waste each week manually compiling recurring reports? Automated reporting is one of those features that frees up valuable resources, eliminating repetitive tasks and dramatically reducing the risk of human error.
Good BI software allows you to:
This not only saves an enormous amount of time, but also ensures that all managers have the up-to-date information they need, exactly when they need it.
While traditional BI tells you what has happened, modern BI, enhanced by artificial intelligence, tells you what is likely to happen. This is where the real game is played. Predictive analytics uses machine learning algorithms to plumb historical data and identify future trends and patterns.
BI platforms that integrate AI don't just visualize the past; they illuminate the future, enabling you to move from reactive management to proactive strategy.
A concrete example? An e-commerce company can predict which products will have peak demand during the upcoming holidays, thereby optimizing inventory and marketing campaigns. Similarly, a financial institution can identify customers at risk of dropping out and intervene with targeted offers to retain them.
The real power of business intelligence software lies in its ability to unify data from disparate sources. Business information is often scattered everywhere: in CRM (such as Salesforce), in ERP (such as SAP), in databases, spreadsheets and social platforms.
A robust BI platform must offer prebuilt connectors for common applications, allowing you to centralize all information into a single "source of truth." This gives you a 360-degree view of your business, which is essential for making consistent strategic decisions. To better understand how these capabilities manifest themselves in practice, you can examine platforms such as Power BI, which demonstrate the importance of broad connectivity.
Choosing the wrong business intelligence platform is like buying a sports car to make a move: an expensive, wholly unsuitable, and ultimately frustrating task. A misjudgment can stall processes, burn valuable budget and, in the worst scenario, lead to decisions based on completely incorrect data. To avoid this disaster, it is essential to start with a clear plan.
The goal is not to find the most powerful business intelligence software on the market, but the one that fits like a glove to your SME's needs, skills and growth goals. This means looking beyond the glittering promises of marketing and digging deep, analyzing a few criteria that will make the difference between success and failure.
Before you even respond to a vendor's first email, you need to be clear on your "must-haves," the non-negotiables. A checklist helps you compare solutions objectively, without being distracted by features that are spectacular but that, in practice, you would never use.
Let's start with the basics, the basic criteria:
Starting with these four points will give you a solid basis for skimming the market and focusing only on candidates who are really right for you.
One of the most classic mistakes is to stop at the cost of the license. The real indicator to watch is the Total Cost of Ownership (TCO), which puts together all expenses, direct and indirect, related to the platform.
TCO is not just the list price. It is the full investment you must make to turn a platform into real value. To ignore it is to open the door to hidden costs ready to sabotage your return on investment.
What's inside the TCO?
Platforms such as Electe, designed specifically for SMBs, offer a clear and predictable TCO. The SaaS model includes support and upgrades, cutting away much of the surprise cost.
The demo is the moment of truth. Don't just passively sit through a presentation. Prepare a list of concrete questions to see if that solution can really solve your everyday problems.
Here are some insights:
The answers to these questions will give you a much more realistic idea of the usability of the platform and the value it can really bring to your business.
Buying business intelligence software is like buying the best toolbox on the market: you have enormous potential on your hands, but you only see the real value when you start building something. Success, in fact, depends less on the platform itself than on how you integrate it into the fabric and culture of your company. You need an action plan, a clear road map to transform a simple platform into a truly data-driven mindset.
This is not a process that should be scary. On the contrary, by following a few logical steps, you can ensure that the investment leads to a tangible return and that the team adopts the new approach without too much resistance, turning data into a real competitive advantage.
Leaving without a clear goal is the quickest way to get lost. Even before looking at a single piece of data, the question to ask is, "What do we want to improve, concretely?" Goals must be specific, measurable and linked to business results.
Generic goals such as "improve sales" do not help. You have to be surgical. Any examples of well-defined goals?
Having such goals allows you to focus your analysis on the metrics that really matter and avoid drowning in a sea of irrelevant data.
Once you have decided on the destination, you need to understand where the information to reach it comes from. An SMB's data is often scattered everywhere: in the CRM, in a thousand spreadsheets, in the management system, on the e-commerce platform.
The next step is to create a true source map. To reduce churn, for example, you will need CRM data, purchase history, and perhaps customer service tickets. BI software must be able to connect to all these sources to unify the picture.
The quality of your insights depends directly on the quality of your data. The "Garbage In, Garbage Out" principle is an iron law in data analysis: if you start with inaccurate or incomplete information, your conclusions will be equally unreliable.
This is the most delicate step and, unfortunately, the one most often overlooked. You can have the best business intelligence software in the world, but if your team doesn't know how to use it or, worse, doesn't understand its value, it will remain a cathedral in the desert.
Investing in training is crucial to overcome the natural resistance to change and get everyone comfortable with the new tools. And it is not just about technical training, but about fostering a true data culture.
This process flow visualizes the key steps for choosing an effective BI platform, focusing on usability, scalability, and integration.
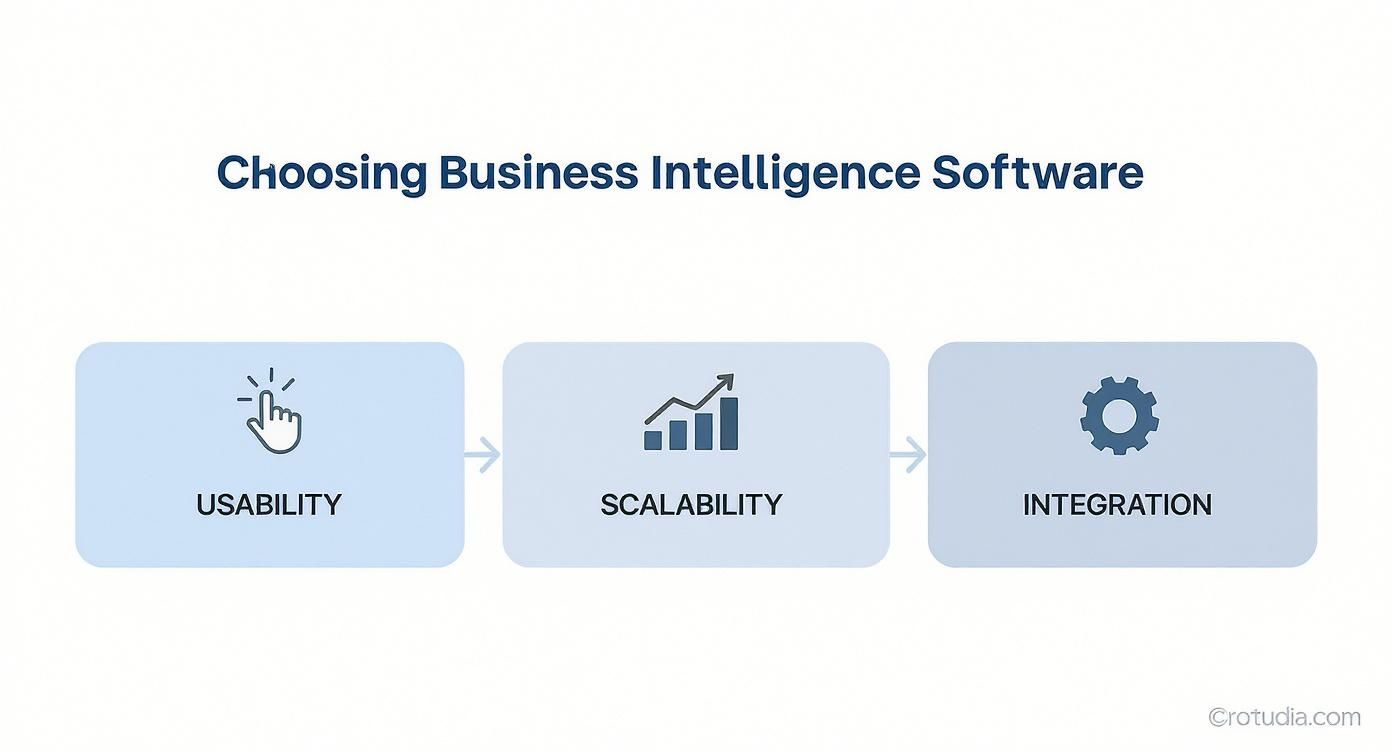
The infographic emphasizes how a strategic assessment goes beyond simple functionality, focusing on how the tool will fit the company and its team over time.
A recent analysis of Italian SMEs revealed thought-provoking data: 60% of companies admit they need to improve internal training on data analysis. More significantly, 29% of companies lack a dedicated figure for strategic data management, highlighting a serious organizational gap. Learn more about how business intelligence helps SMEs stay competitive.
The most common mistake is to want to solve all business problems the first time. Better to start with a pilot project, focused on one of the previously defined goals. First reports are created, simple but impactful dashboards. Getting quick results, however small, is the best way to demonstrate the value of BI and generate enthusiasm.
Once the initial analyses are underway, it is critical to establish an ongoing feedback loop:
This iterative approach makes it possible to constantly refine the BI strategy, adapting it to changing business needs and ensuring a solid and lasting return on investment.

Artificial intelligence has changed the rules of the game for business intelligence software. For years, BI was like a rearview mirror: a very useful tool for looking at what had already happened. Today, thanks to AI, it has turned into a strategic partner that looks ahead, pointing the best way forward.
It is the integration of technologies such as artificial intelligence and machine learning (ML) that is driving this evolution. Thanks to these advances, you are no longer limited to descriptive analysis. You enter a dynamic ecosystem, where predictive and prescriptive BI tools revolutionize the way you make decisions.
This is not just a matter of having more sophisticated technology. It is about making data analysis smarter, more accessible and, above all, concretely useful for SMEs.
One of the most concrete changes brought about by AI isaugmented analytics, or augmented analytics. Imagine having a tireless assistant analyst working for you around the clock. It scans your data for patterns, correlations and anomalies that a human would take days to find.
This is what augmented analytics does, in practice. It leverages machine learning algorithms to:
This feature democratizes access to insights. Even those without a data scientist background can finally ask complex questions of their data and get clear, immediate answers.
AI pushes business intelligence far beyond just "what happened?" by introducing two much more strategic levels of analysis.
Predictive analytics uses historical data to predict what is likely to happen in the future. For example, a platform such as Electe can analyze past sales to estimate demand in the coming months, helping you optimize inventory and make sure you are not unprepared. If you want to better understand how it works, we have prepared a guide on how to use predictive analytics with Electe's forecasting feature.
But AI does not stop there.Prescriptive analytics goes a step further, suggesting concrete actions to be taken to achieve a given goal.
Prescriptive analysis doesn't just tell you that it's likely to rain; it also advises you to take an umbrella. In business, this translates into concrete suggestions, such as which discount to apply to a product to maximize profits.
For an in-depth analysis of how artificial intelligence compares with traditional approaches, it is worth exploring the debate between the effectiveness of AI and classical financial models. This perspective enriches the understanding of the unique value AI brings to business intelligence software.
Ultimately, AI is transforming BI software from a passive reporting tool to an active growth engine. Platforms such as Electe were created precisely to bring this power directly into the hands of SMEs, making advanced analytics no longer a privilege for a few, but a standard for all.
To turn your data into a competitive advantage, here are the basic steps to remember:
Adopting business intelligence software is not just buying new technology; it is choosing to lead your business with greater clarity, confidence and strategic agility. It is an investment in your SME's future, turning uncertainty into opportunity and gut instinct into informed decision-making.
Are you ready to turn your data into decisions that matter? Find out how the AI-powered data analytics platform from Electe can illuminate your company's growth path.

.svg)
.svg)
.svg)
.jpeg)