Index-based financial statement analysis is the compass that transforms complex numbers into a clear map of your company's financial health. It is not just an exercise for accountants, but a fundamental strategic tool that allows you to make informed decisions and, above all, anticipate problems before they become critical.
Think of it as an expert doctor's diagnosis: each index measures a vital parameter, from liquidity to profitability. Today, thanks to artificial intelligence, this diagnosis is not limited to capturing the past, but can predict the future, alerting you to potential crises months in advance. This guide will show you how to make the most of both traditional and predictive analytics to confidently steer your SME toward success.
Think of the financial statements—which combine the balance sheet, income statement, and cash flow statement—as a blood test report. On their own, they are a list of technical values. But when an expert interprets them, those numbers tell a precise story, revealing the overall health, strengths, and areas that require immediate attention.
That's exactly whatindex-based financial statement analysis does for your business: it translates accounting data into a clear narrative about its stability and growth prospects. It provides you with a roadmap to understand not only where you are today, but also which paths to take tomorrow.
Financial ratios are the "biomarkers" of your business. You don't need a degree in finance to understand their value; you just need to know what questions to ask to get the right answers.
The analysis focuses on four key areas, just as a doctor would check the different systems of the human body. We have summarized these concepts in a table to give you an immediate overview.
The four pillars of budget analysis
Understanding these indicators is everything.
A company can record very high profits but still go bankrupt due to a lack of liquidity. This is an all too common paradox, which only a proper analysis of the financial statements can reveal and prevent.
This analysis, therefore, is anything but an academic exercise. It is an indispensable navigation tool for anyone who wants to steer their company safely, anticipating risks and discovering opportunities hidden between the lines of the numbers.
Today, thanks to platforms such as Electe, this diagnostic process is no longer reserved for large groups or specialists. Technology allows you to transform raw data into clear and immediately usable insights, turning financial statement analysis into a real competitive advantage.
In the following paragraphs, we will go into detail to see how to calculate and, above all, how to interpret the most important indices for your SME.
Once the pillars of the analysis have been clarified, it's time to get your hands dirty. The first question you need to answer is as simple as it is decisive: can your company pay its bills tomorrow? Immediately after that comes the second question: is its financial structure robust enough to withstand shocks and sustain growth?
To find these answers,balance sheet ratio analysis focuses on two key areas: liquidity and solvency. The former is a snapshot of short-term health, while the latter is a measure of long-term resilience. Together, they paint a crystal-clear picture of your company's financial health.
This concept map summarizes the concept well: the health of a business is based on vitality (liquidity), strength (solidity), and performance (profitability).
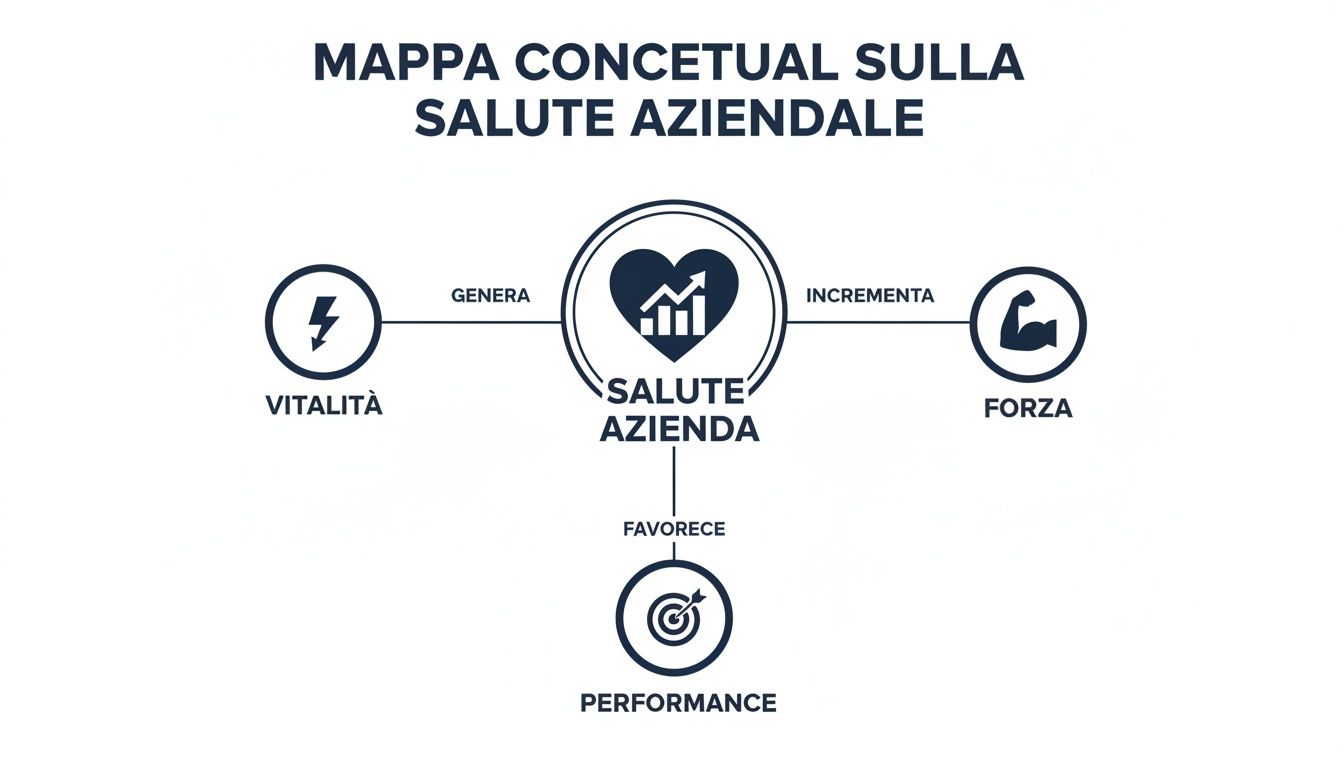
As you can see, only when liquidity and solidity are secure can your company truly focus on performance, triggering a virtuous circle of stability and growth.
Liquidity ratios measure a company's ability to meet its short-term financial commitments, i.e., those due within 12 months. Think of them as a diver's oxygen supply: they tell you whether you have enough "air" to keep swimming without running out of breath.
The two most commonly used indicators are undoubtedly the current ratio and the quick ratio.
This index compares current assets (cash, receivables, inventory) with current liabilities (payables to suppliers, short-term bank loans, taxes). It is the first, fundamental check-up.
Formula: Current Ratio = Current Assets / Current Liabilities
An optimal value is considered to be between 1.5 and 2.0. If it falls below 1, the company may struggle to cover upcoming expenses. Conversely, an excessively high value could be a sign of inefficiency: too much money sitting in the account that is not being used to grow the business.
The Quick Ratio is the "strict" version of the Current Ratio. Why? Because it excludes inventory from the calculation. As we know, inventories are not always so easy and quick to convert into cash.
Formula: Quick Ratio = (Current Assets - Inventory) / Current Liabilities
Here, a value greater than 1 is generally considered a good sign. If your Quick Ratio is solid, it means you can pay all your short-term debts without having to sell off your inventory. It's a real stress test, crucial especially for companies with large inventories.
If liquidity is the present, solidity is the future. These ratios assess the stability of the capital structure over the long term and tell us how much your company depends on external financing. In other words, they answer the question: is the company built on solid foundations or is it a house of cards?
The key indicator for understanding this is the debt-to-equity ratio.
This ratio is a direct comparison between total debt (both short-term and long-term) and the company's net assets.
Formula: Debt-to-Equity Ratio = Total Debt / Net Equity
A low value is excellent news: it means that the company is mainly financed by its own means (share capital, retained earnings), which makes it less risky in the eyes of banks and investors. A high value, on the other hand, indicates a strong dependence on loans, increasing financial risk.
There is no magic number that applies to everyone, because a lot depends on the sector. However, values above 2.0 are often a warning sign, because they indicate that the company is financed more by creditors than by shareholders. For a serious assessment, it is essential to compare this figure with the benchmarks for your specific sector.
Keeping these liquidity and solvency ratios under control is the first step toward informed financial management. It allows you to move from reacting to problems to preventing them, making decisions that not only ensure survival today but also build prosperity for tomorrow.
If liquidity and solidity are the foundations of a healthy company, profitability and efficiency are its driving force. Of course, generating high sales volumes is an excellent start, but the real strategic question is another: how much of that turnover is turning into real profit? And how effectively are you using your resources to achieve this?
Index-based financial statement analysis comes into its own here, with two categories of indicators that complement each other. Profitability indices are the barometer of economic success, while efficiency indices are the magnifying glass on operational processes. Analyzing them together allows you to understand not only whether you are making a profit, but above all how and where you can make more.
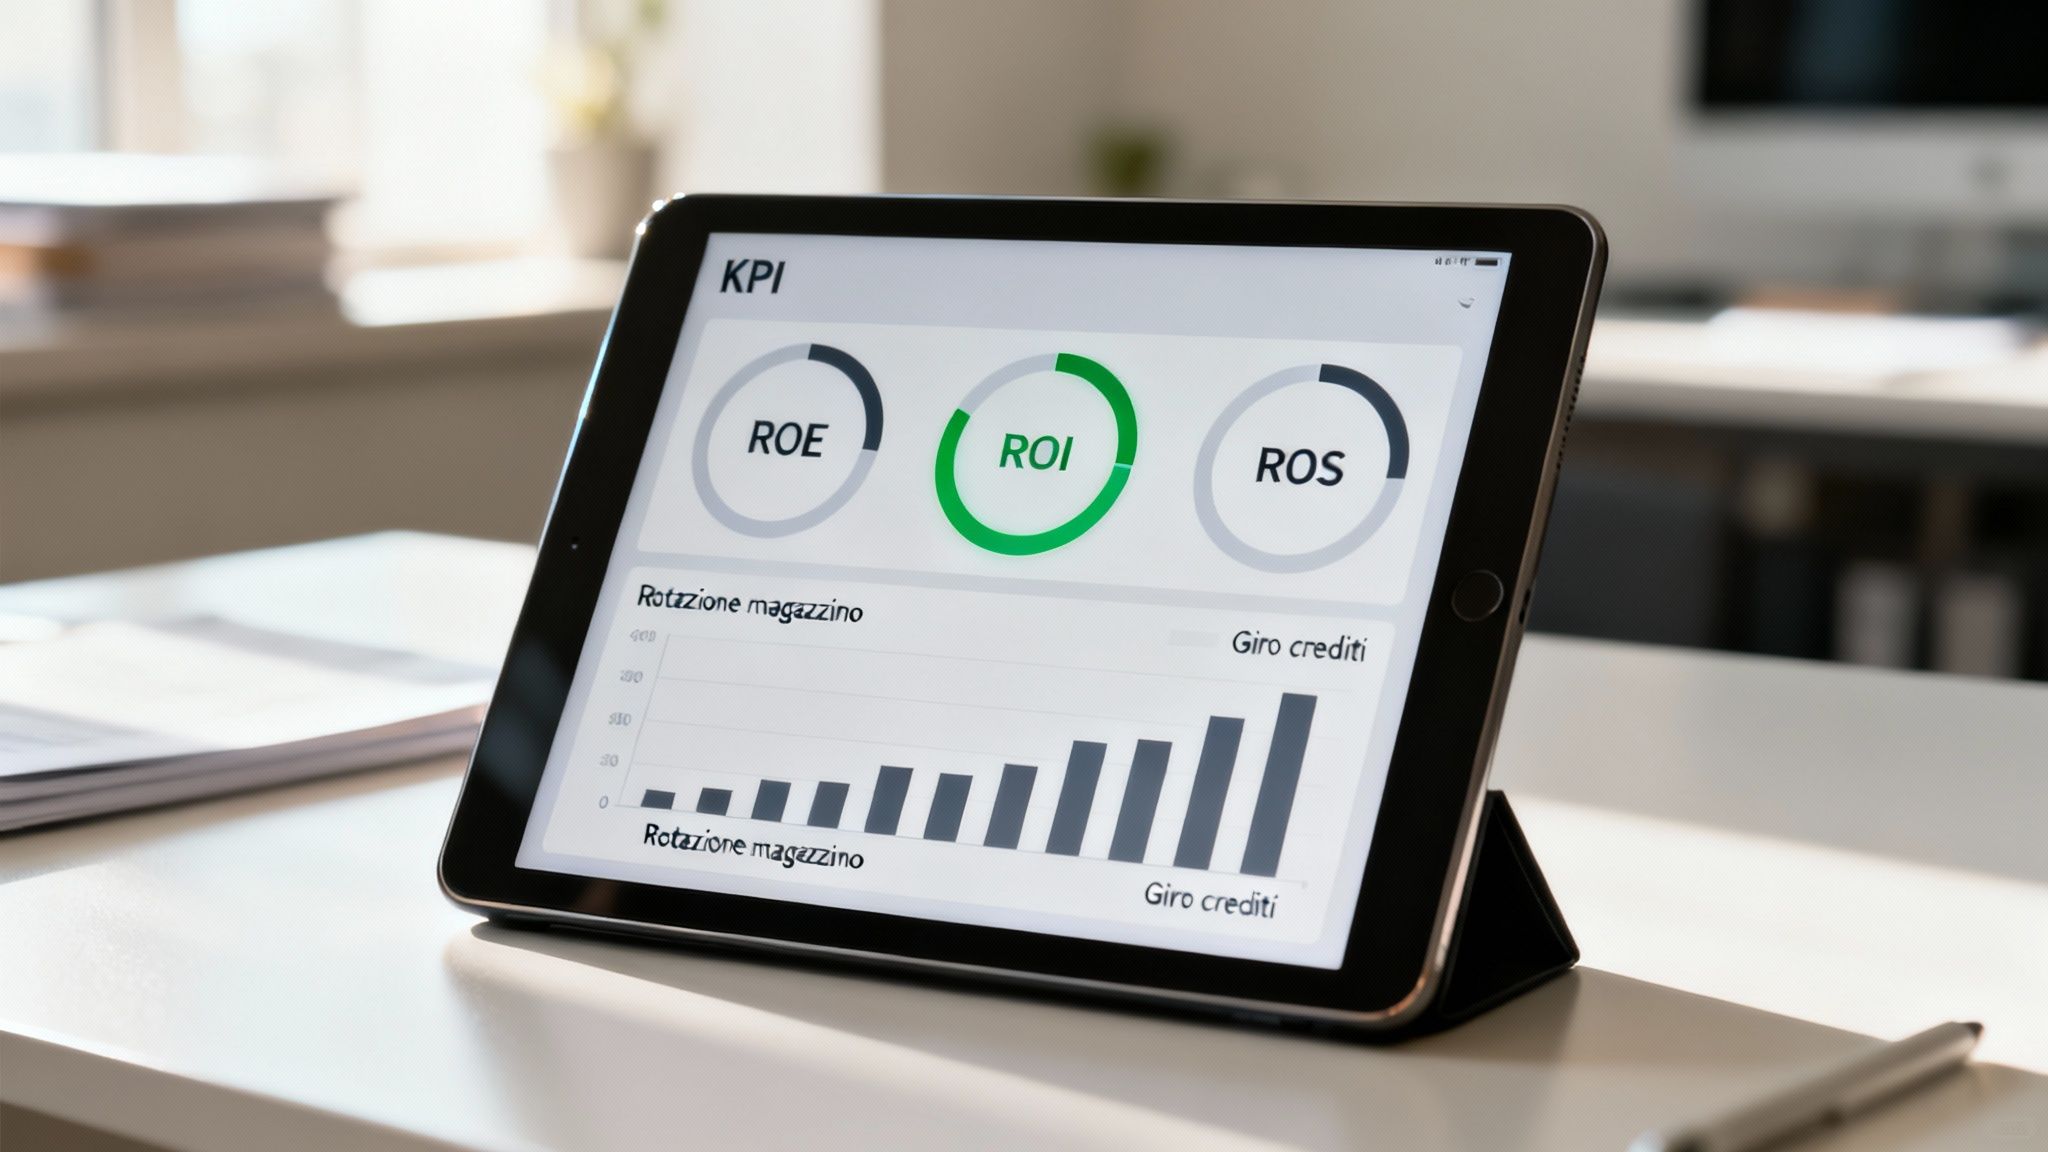
These indices are at the heart of assessing your company's ability to generate value. Let's start with the three main ones.
Interpreting these indices always requires comparison. A 10% ROI may be excellent in a mature, low-margin sector, but disappointing in a high-growth technology sector.
A recent study has shown that the best-performing Italian companies stand out not only for their revenue growth, but above all for their ability to maintain solid operating margins. This demonstrates that increased sales alone are not enough; indicators such as ROE and ROS are crucial for understanding whether that growth corresponds to real value creation.
If profitability is the result, efficiency is the process for achieving it. These indicators measure how well you are managing your key operating resources, namely inventory and receivables. Excellent management in these areas translates directly into greater liquidity and higher profits.
This index tells you how many times in a year the warehouse is completely sold out and replaced. Fast turnover is generally a very positive sign.
Formula: Inventory Turnover Ratio = Cost of Goods Sold / Average Inventory
A low value may indicate that you have unsold merchandise that ties up capital and risks becoming obsolete. Be careful, however, because too high a value could signal the risk of stock shortages, resulting in lost sales. The goal is to find the right balance for your industry.
This indicator is vital for liquidity management. In practice, it measures how quickly your company is able to collect payments from its customers.
Formula: Credit Turnover Ratio = Revenue / Average Trade Receivables
High turnover means that customers pay quickly, improving your cash flow. Slow turnover, on the other hand, is a warning sign: you are effectively financing your customers. This situation could hide future liquidity problems, even if turnover is good.
To analyze all these KPIs in an integrated way, it is essential to have the right tools at your disposal. If you want to learn more about how modern platforms can help you, read our guide to business intelligence software and find out how to turn data into strategic decisions.
Constantly monitoring both profitability and efficiency gives you a complete picture. You don't just look at the finish line (profit), but analyze every step of the race (operational management), identifying exactly where you can improve to run faster and with less effort.
Traditional analysis is like looking in the rearview mirror: it tells you exactly where you've been. Artificial intelligence, on the other hand, gives you binoculars to scan the horizon.Balance sheet index analysis thus ceases to be merely a diagnosis of the past and becomes a navigation system for the future. Instead of reacting to results, you can start anticipating trends with advance warning that can make all the difference.
The superpower of AI is to analyze historical series of dozens of indicators simultaneously, finding correlations invisible to the human eye. An analyst might notice a decline in the current ratio. An AI system, on the other hand, sees that this decline, combined with a slight lengthening of collection times and an almost imperceptible decrease in inventory turnover, has preceded a liquidity crisis in 95% of similar cases analyzed in the past.
Practical example: predictive alarm
Imagine that your current ratio has been falling for three months but is still above the safety threshold of 1.5. To the human eye, the situation needs to be monitored but is not yet critical.
An AI model, however, sees the bigger picture:
The result is not just a number, but a strategic warning.
Predictive Alert: "Warning: if current trends continue, there is an 80% probability of falling below the critical liquidity threshold within the next 3-6 months."
This is not just a prediction, it is information that allows you to take action. You have months to take action: you can renegotiate payment terms, launch a discount campaign to clear your inventory, or seek a new line of credit on favorable terms before you find yourself in dire straits. This proactive approach is a pillar of financial stability, as demonstrated by the public management analyses found in the recent Istat report.
Until yesterday, predictive analytics was a luxury reserved for multinational corporations with entire teams of data scientists. Today, Electe, an AI-powered data analytics platform for SMEs, finally makes these capabilities accessible to all businesses.
Electe the entire process, without you having to write a single line of code:
In this way,financial statement analysis takes an evolutionary leap forward. It is no longer just a rearview mirror showing you the road you have already traveled, but becomes an advanced dashboard that illuminates the path ahead. To guide your company with greater confidence and strategic vision.
Anyone who has ever tried to analyze a balance sheet "by hand" knows what we are talking about: endless hours spent on spreadsheets, the fear of making a mistake in a formula, and the effort of transforming a mountain of numbers into something understandable. Fortunately, technology comes to our rescue today.
Platforms such as Electe were created precisely for this reason: to remove complexity and put the powerof balance sheet analysis in the hands of those who run the company, without the need for an entire team of analysts.

A platform such as Electe the entire flow, transforming a process that previously took days into an operation that takes just a few minutes.
It all boils down to three simple steps:
This approach not only saves a tremendous amount of time, but also eliminates the risk of human error, giving you the confidence that your decisions are based on solid information. If you want to better understand how these tools are built, our guide on how to create analytical dashboards with Electe provides a comprehensive overview.
The real value lies not only in automating calculations. It lies in transforming raw data into strategic insights that are accessible with a single click and understandable to the entire team.
Automation, however, is much more than just creating reports. Its real superpower is its ability to monitor your company's financial health in real time and alert you before a problem becomes a crisis.
With Electe, you can set custom alert thresholds in just a few clicks. For example, you can create a rule that sends you an automatic notification whenever:
A proactive alert system like this completely changes the rules of the game. Instead of discovering a liquidity problem at the end of the month, you receive an instant alert that allows you to take immediate action.
In short, Electe the solution designed for SMEs that want to adopt modern financial analysis without the complexity and costs of traditional systems. Making data-driven management a concrete and accessible reality is finally possible.
A poorly conducted financial analysis is worse than no analysis at all. It can lead to disastrous decisions. For this reason, knowing the most common pitfalls is the first step in turningbalance sheet index analysis into a true strategic ally.
The most common approach? Looking at a single index and nothing else. It's like trying to understand a movie by looking at a single frame. A very high ROI may seem like a victory, but if it is combined with a liquidity index at historic lows, the story changes. It could be a sign of a company growing too fast, on the verge of collapse due to a lack of cash.
Another very common mistake is forgetting to look outside the window. Analyzing your own indices without ever comparing them to industry benchmarks is a pointless exercise. A profit margin of 5% may be an excellent result in large-scale distribution, but it would sound like an alarm bell in the world of software.
Without an external benchmark, your numbers are meaningless. You don't know if your performance is above or below average, nor where the real opportunities for improvement lie.
You can use the most sophisticated algorithm in the world, but it won't help if the source data is dirty or incomplete. It's like building a skyscraper on a foundation of sand.
Relying on hand-compiled spreadsheets opens the door to typos, incorrect formulas, and outdated information. The result is a distorted picture of reality.
Here are the most critical mistakes to avoid:
A centralized platform such as Electe was created precisely to minimize these risks. By automating data collection and calculation, it guarantees impeccable accuracy and gives you an overview. This way, your decisions are based on a clear and complete picture.
We have seen together howindex analysis is a real strategic tool to guide your company. To dispel any remaining doubts, here are the answers to the most common questions.
For most SMEs, a quarterly analysis strikes the right balance. It allows you to identify trends and make adjustments. However, some ratios, such as the current ratio and quick ratio, should be monitored at least once a month. Platforms such as Electe automate these checks, sending you real-time alerts if something is wrong.
Comparing your numbers with the industry average is the only way to understand if you are truly performing well. The most common sources for this data are:
Business intelligence platforms such as Electe already Electe these benchmarks built in: the dashboards automatically show you the comparison, without you having to search or calculate anything.
Absolutely. In fact, it's perhaps even more important. Especially when you're just starting out, monitoring a few key indicators (such as margin and liquidity) is vital for building a sound financial foundation, making smarter decisions about growth, and presenting yourself more credibly to an investor or bank.
Ready to transform your balance sheet ratio analysis from a manual chore to an automated strategic advantage? With Electe, you can shed light on your company's future.

.svg)
.svg)
.svg)