Balance sheet ratio analysis is nothing more than a translator. It takes complex balance sheet figures and transforms them into simple, straightforward indicators that give you an immediate diagnosis of your company's health. Instead of drowning in hundreds of accounting entries, you have a clear assessment of liquidity, profitability, and solidity at your fingertips, allowing you to make more informed decisions.
Have you ever wondered how some entrepreneurs make strategic decisions so bold that they always seem to be one step ahead of the market? It's not magic, but careful analysis of the numbers. This guide was created to debunk the myth of financial statement analysis, transforming it from an exercise for the few into a concrete management tool for every SME.
Think of your balance sheet as a car dashboard. There is a lot of information, but to drive safely, you focus on a few key indicators: speed, fuel level, engine temperature. Balance sheet ratios work exactly like this, translating raw data into language that clearly tells you:
Our goal is to show you that you don't have to be a financial analyst to understand where your business is headed and what levers you need to pull to correct the course. We'll start with the basics, explaining what indices are and how they are calculated. Then we'll show you how to interpret them in the context of your industry. Finally, you'll see how AI-powered platforms such as Electe can eliminate manual work, transforming data into a real competitive advantage.
To truly understand your company, it's not enough to look at a string of numbers. You need to look at it from four different perspectives, each of which tells you a fundamental part of its story.Balance sheet index analysis brings order to this vision, organizing it into four pillars that make everything more intuitive and, above all, strategic.
Think of your company as a race car. Every component is vital to its overall performance.
This simple hierarchy shows how a comprehensive financial statement analysis always starts with aggregate data and then drills down into the details of operating and financial performance, touching on the areas of liquidity, solvency, and profitability.
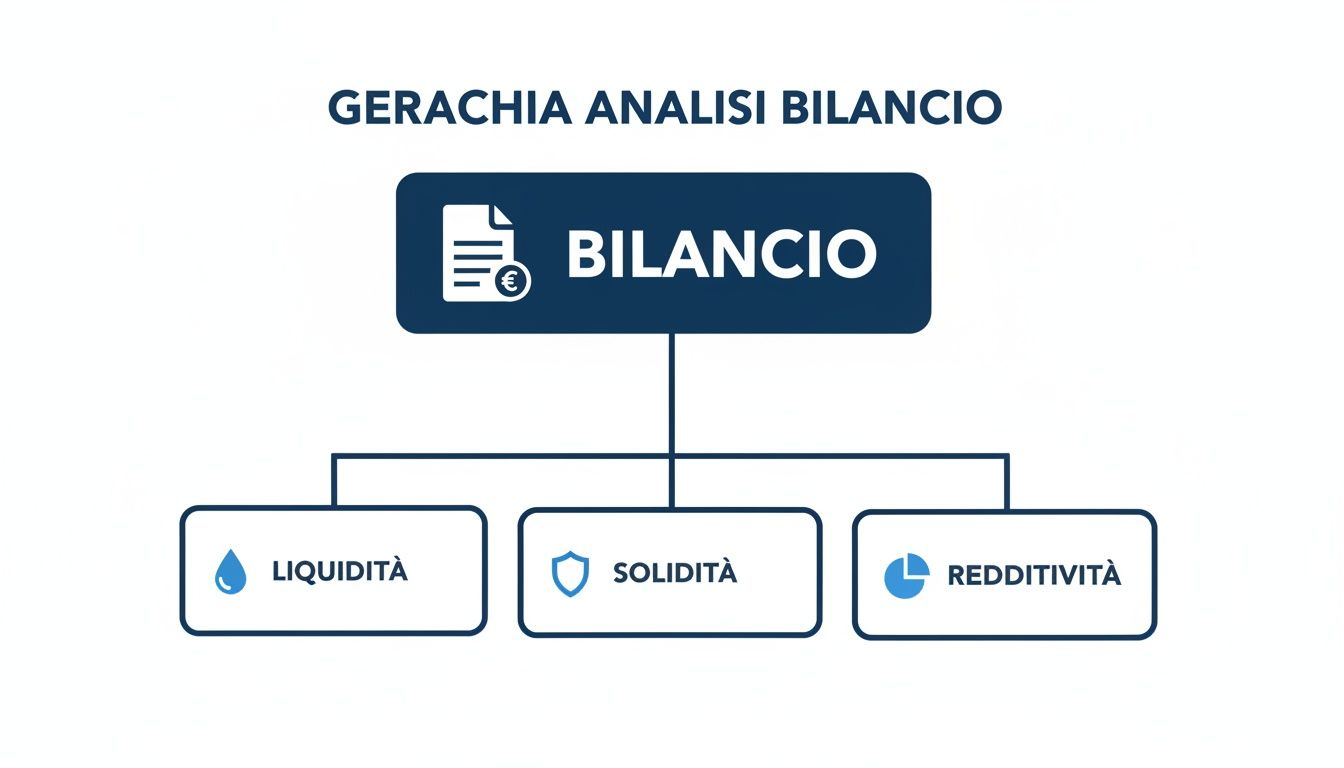
Let's now take a closer look at each pillar to understand which indices to use and what they really mean.
To get an overview, let's start with a summary table.
This table summarizes the four main types of indices, their purpose, and the key indicators for each category.
Category of Indices Main PurposeExamplesofKeyIndicesLiquidity Measurethe ability to cover short-term obligations. Current Ratio, Quick Ratio (Acid Test)Solidity Assessthe financial structure and sustainability of long-term debt.Debt-to-EquityRatioProfitabilityMeasureseffectiveness in generating profits from sales, assets, and capital.ROE (Return on Equity), ROI (Return on Investment)EfficiencyAnalyzeshow efficiently the company uses its resources to generate revenue.Inventory Turnover, Average Days Sales Outstanding (DSO)
This map helps you find your way around. Now let's see how to use these tools in practice.
These ratios measure your company's ability to pay short-term debts (those due within 12 months) using assets that can be quickly converted into cash. Low liquidity is a powerful warning sign: even a company that is profitable on paper can go bankrupt if it does not have the money to pay salaries, suppliers, and taxes.
Current Ratio
It is the most commonly used indicator and compares current assets with current liabilities.
Current Assets / Current LiabilitiesQuick Ratio (Acid Test Ratio)
This is a more rigorous test. It excludes inventory from the calculation, because it is not certain that you will be able to sell it overnight.
(Current Assets - Inventories) / Current LiabilitiesSolidity, also known as solvency, looks at the financial structure of the company. It helps to understand whether it is built on rock or sand, assessing its ability to sustain itself in the long term. In short, it shows how much you depend on other people's money (banks, lenders) compared to your own.
Debt-to-Equity Ratio
This is the main indicator for measuring the famous financial leverage. It compares total debt with net equity.
Total Liabilities / Net EquityA company that is too heavily indebted is like a boat with an excessive load: stable in calm seas, but one step away from capsizing at the first real storm. Finding the right balance is crucial for long-term navigation.
Profitability is at the heart of every business. These ratios not only tell you whether you are making money, but how effectively you are generating profits from sales, assets, and the capital that shareholders have put into the company.
ROE (Return on Equity)
Measures the return on investment for shareholders. It is one of the most closely watched indicators by anyone looking to invest in a company.
Net Profit / Net EquityROI (Return on Investment)
Assess management's ability to generate income using all invested capital, both its own and that of third parties.
Operating profit / Total assetsEfficiency ratios, often referred to as turnover ratios, tell you how well your company is using its resources (assets) to generate revenue. They answer concrete questions such as: "How quickly do we sell the goods in stock?" or "How long does it take us to collect payments from customers?"
Inventory Turnover
If you have a company that sells physical products, this index is your bread and butter.
Cost of Goods Sold / Average InventoryAverage Days Sales Outstanding (DSO)
Measures the average number of days that pass from when you issue an invoice to when the customer pays you.
(Trade receivables / Turnover) * 365Analyzing these four pillars gives you a 360-degree view. It allows you to immediately understand where you are strong and where you need to take action before a small crack becomes a chasm.
Calculating a balance sheet index is only the first step. A number on its own means very little. It is the context that gives it meaning, transforming it into strategic insight for your company. Only by comparing figures can you understand whether your performance is a success to be celebrated or a warning sign to be heeded immediately.
Let's take a concrete example. Imagine you have achieved a ROE (Return on Equity) of 10%. Is that good? Bad? The answer is: it depends. If you operate in a mature and stable sector such as manufacturing, it could be an excellent result. But in a booming technology market, where competitors are growing at rates of 25-30%, that 10% suddenly becomes disappointing.
To avoid superficial assessments, your analysis of financial ratios must always be based on two types of comparison.
The first comparison, the most immediate and important one, is with yourself. Line up your company's indices for the last 3-5 years to see trends and understand the direction you are heading in.
A liquidity ratio that, despite being above the safety threshold, has been falling steadily for three years is a sign that should not be ignored. It means that something is eroding your cash flow and you need to take action before it becomes a critical problem.
This type of analysis answers fundamental questions for those who manage a business:
Analyzing historical data forces you to develop critical thinking and read beyond the individual number. This approach is one of the pillars for fully exploiting the advantages of Big Data analytics for SMEs, turning the past into a guide for the future.
The second comparison, which is equally crucial, is with the market. Positioning your company relative to your competitors gives you an objective measure of your performance. Are you doing better or worse than the average for your industry?
Finding reliable benchmark data is easier than you think. Here's where you can look:
This data is pure oxygen for understanding whether your performance is in line with the market. For example, a recent analysis of Italian companies showed enormous differences at the regional level. In 2023, the South recorded a 9.2% increase in turnover, while the Center saw a 13.8% decline . Liquidity also showed disparities, with an average current ratio of 1.45 in the South compared to 1.32 in the North . You can learn more about this data by reading the Observatory on Italian Company Financial Statements.
Without these comparisons, you risk navigating blindly. The correct interpretation of numbers is the true beating heart of business management that is not based on feelings, but on concrete data.
Theory is one thing, but it is only when you apply it to real cases that the light comes on. The numbers in a balance sheet, taken individually, can seem cold and distant. In reality, they are chapters in the history of your company.
In this section, we will see howfinancial statement analysis can be transformed from a purely accounting exercise into a strategic compass. We will follow the journey of two SMEs that, like many others, face real challenges every day: "Alfa Retail," an electronics store, and "Beta Services," a digital consulting agency.
Through their journeys, you will see firsthand how correctly interpreting indices can have a direct, measurable, and sometimes surprising impact on business performance.

For months, Alfa Retail had been experiencing a frustrating paradox: sales were growing, but the cash register was always empty. Paying suppliers had become a challenge, and credit lines with banks were almost at their limit. It felt like running on a treadmill, struggling hard to stay in place.
Our first move was to focus on efficiency indicators, particularly inventory turnover. The numbers spoke for themselves right away:
That figure was the first real wake-up call. Alfa's warehouse was operating at almost half the speed of its competitors. In practice, goods remained on the shelves for an average of 146 days (365 / 2.5), which is an eternity compared to the 85-95 days taken by competitors.
Slow-moving inventory is like an anchor thrown to the bottom of the sea: it slows down liquidity and prevents the company from moving forward. Every unsold product is tied-up capital that cannot be used to seize new growth opportunities.
Digging deeper, we discovered that 25% of inventory consisted of obsolete products. Not only were they tying up cash, but they were also taking up valuable space that could have been dedicated to best-selling products with more attractive margins.
Corrective actions were targeted and immediate:
A year later, the music had completely changed. Let's look at how the key indices have moved.
Here is a numerical example of how index analysis has guided strategic decisions capable of transforming financial performance.
IndicatorPrevious Year ValueCurrent Year Value (Post-Intervention)Interpretation ofImprovementInventory Turnover2.5times3.8 timesGoods now rotate almost in line with the industry benchmark, freeing up liquidity.Current Ratio1.11.6The ability to meet short-term commitments has improved significantly.Average Days Sales Outstanding (DSO)45 days35 daysNew collection policies have accelerated cash inflows.ROI (Return on Investment)7%11%Increased efficiency has freed up resources, improving overall profitability.
This case teaches you a fundamental lesson: sometimes, a single index, if read carefully, can reveal a crucial operational problem and trigger corrective actions with a measurable impact on the overall health of the company.
Beta Services, a rapidly expanding digital agency, had the opposite problem. It was constantly acquiring new customers, but at the end of the year, net profits were always disappointing. Margins seemed to melt away like snow in the sun.
Here, the analysis focused on profitability ratios. Two in particular raised alarm bells: the operating margin (ROS) andthe impact of personnel costs on turnover.
The verdict was unequivocal: labor costs were out of control. A more granular analysis revealed that the agency was dedicating too many hours to low-margin clients and did not have a system in place to monitor the time allocated to individual jobs.
Corrective actions focused on operational efficiency:
After twelve months, turnover had not increased dramatically, but profitability had been transformed. ROS rose to 13% and the incidence of personnel costs fell to 58%, realigning with the values of the best competitors.
These two examples demonstrate thatbalance sheet ratio analysis is a powerful magnifying glass that, when focused on the right areas, allows you to see hidden inefficiencies and unlock the true potential of your SME.
An incorrect analysis of financial statements can lead to decisions that are worse than not making any decisions at all. Relying on numbers without critical thinking is the quickest way to make strategic mistakes.
Fortunately, the most common pitfalls are well known. With a little care, you can easily avoid them and ensure that your balance sheet analysis is always rigorous and reliable.
It is a very human temptation: to focus only on the indices that prove you right, highlighting a growing ROE but ignoring a liquidity index in free fall.
How can you remedy this? Create a fixed dashboard with 5-7 key indices covering all four pillars of analysis: liquidity, solidity, profitability, and efficiency. Always look at them all together to get an honest overview.
Another classic mistake is comparing companies that have nothing to do with each other. Evaluating a technology startup using the same parameters as an established manufacturing company is simply wrong.
How can you remedy this? Always compare your performance with that of direct competitors in terms of size, sector, and market. If you do not have access to their financial statements, use the sector averages provided by trade associations or chambers of commerce.
Ignoring context is like looking at a single frame of a movie and claiming to understand the plot. Every number has a story, and that story is defined by the industry, company size, and historical moment.
The financial statements are not just a table of numbers. The explanatory notes explain the reasons behind those figures. For example, a sudden increase in liquidity may not be the result of good management, but rather the sale of a property. Ignoring these details means only seeing half the picture. A superficial analysis can be dangerous; consider that a thorough examination has shown that in Veneto, average payment delays of 45 days are recorded. Discover how a detailed analysis can reveal hidden operational risks.
Limiting yourself toa once-a-yearbudget analysis is like checking your map only once at the start of a long journey. The world changes quickly, and a static view is no longer enough to guide a company in today's market.
How can you remedy this? Set up quarterly or, even better, monthly monitoring. Platforms such as Electe were created for this purpose: they automate the process and provide you with real-time dashboards that allow you to spot trends as they emerge, rather than when it is too late to react.
You've learned to read the numbers, recognize the pillars of a healthy business, and avoid common mistakes. But now the question is: how do you apply all this without drowning in spreadsheets? The answer is not to work harder, but to work smarter. And today, that means using artificial intelligence.
Manualbudget analysis isn't just slow; it's a minefield. Every poorly dragged formula is a potential error. And above all, it offers a static snapshot, a view of the past that almost always arrives too late for the decisions you need to make today.
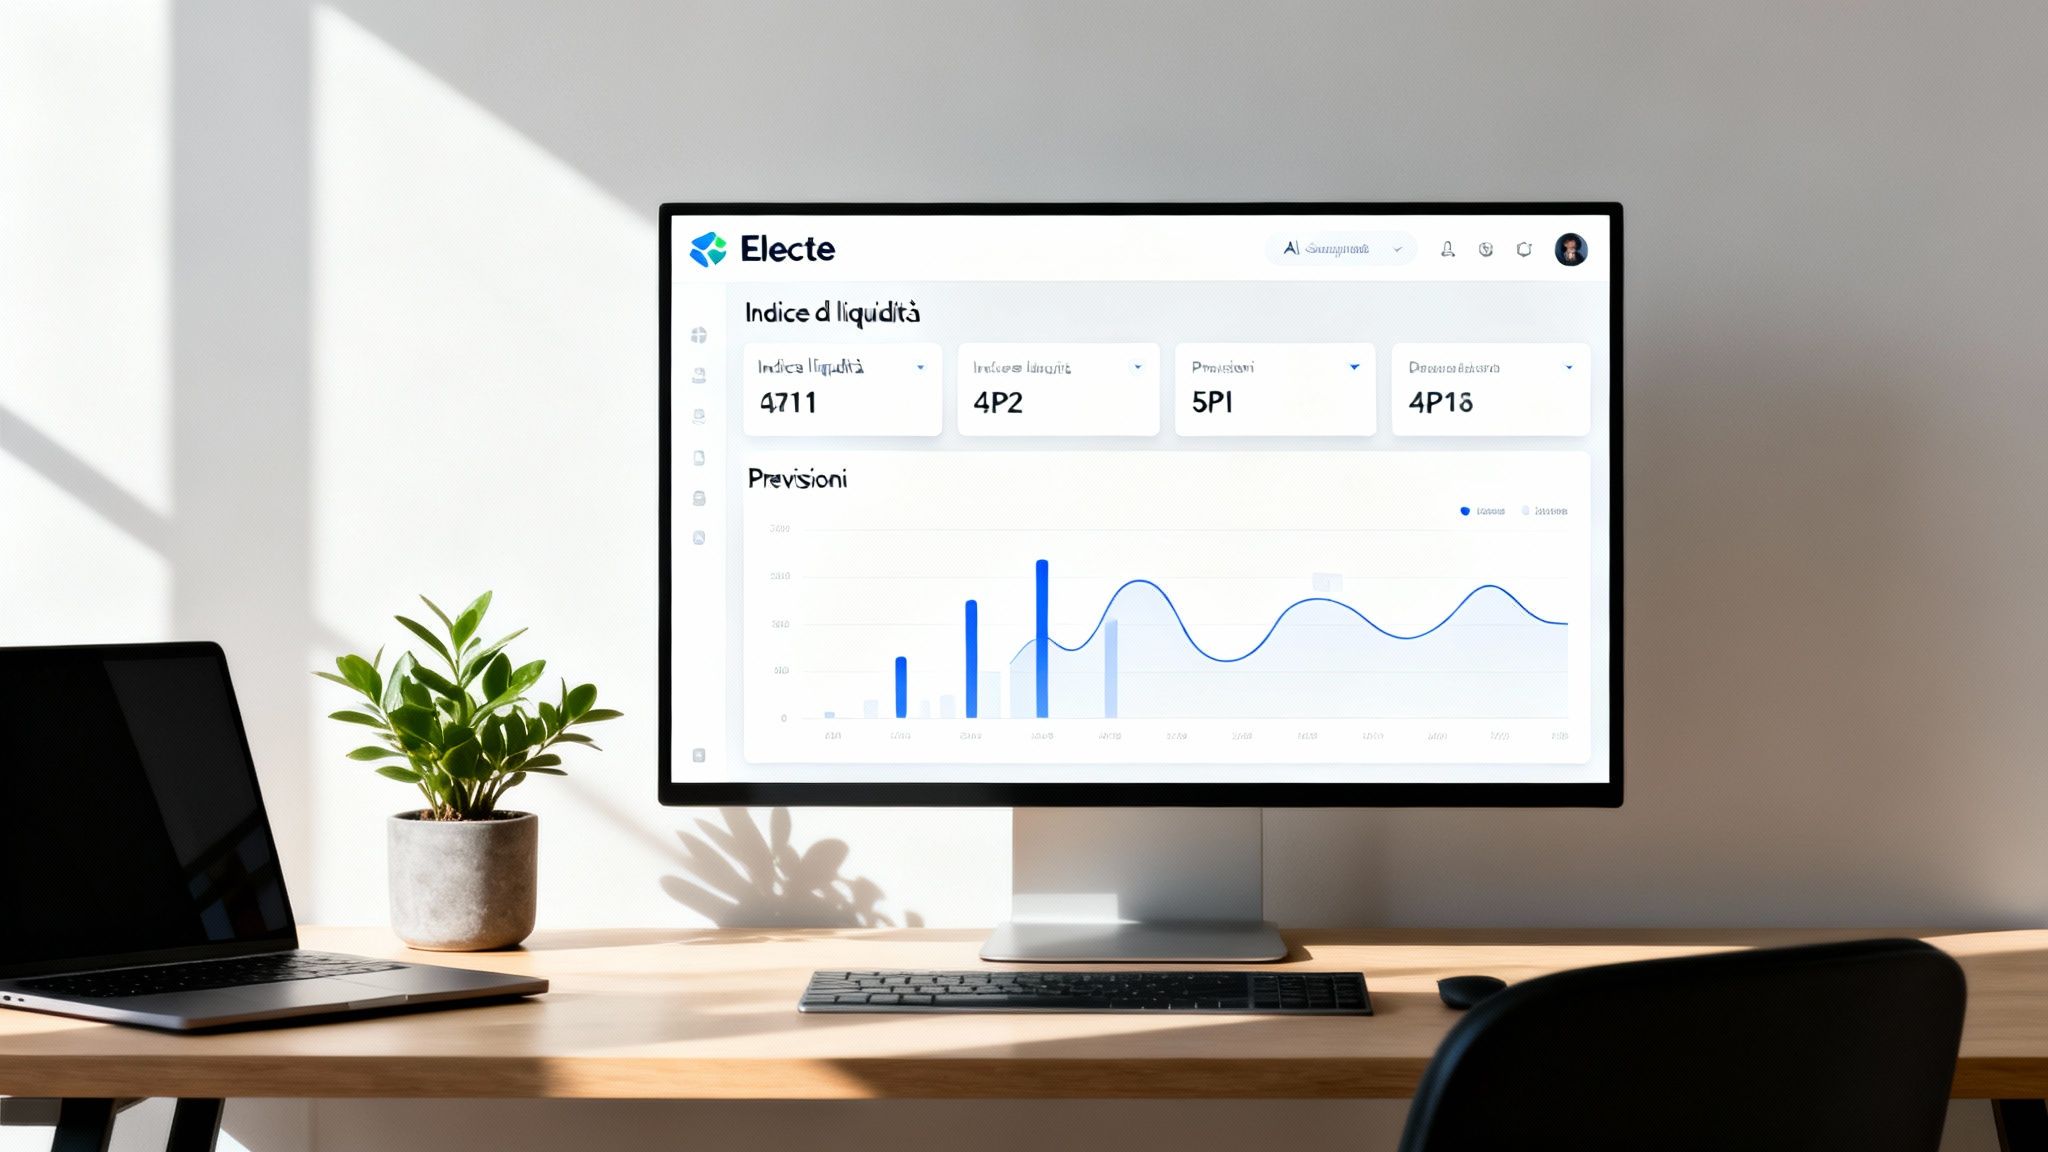
This is where a data analytics platform like Electe comes in, our AI-powered tool tailored for SMEs. The basic idea is simple: transform your financial data from a periodic obligation into a continuous strategic advantage.
Instead of exporting data and struggling with formulas, the platform connects to your management systems and automates the calculation of indices in real time. Imagine having your financial KPIs always up to date, displayed in interactive dashboards. If you're interested in learning more, take a look at the best business intelligence software for SMEs and discover how they can change your relationship with numbers.
Thanks to artificial intelligence, financial statement analysis is no longer a rearview mirror focused on the past. It becomes a headlight that illuminates the road ahead, allowing you to act proactively, not reactively.
Electe AI Electe just calculate the present; it analyzes historical data series to uncover hidden patterns and predict future trends with a precision that human analysis could never achieve. Think about what it would mean to be able to anticipate a drop in liquidity three months in advance. Or to identify which products will see a decline in demand, so you can optimize your inventory before they become a cost to your warehouse.
This predictive approach is a key weapon. Platforms such as Electe AI to translate macroeconomic trends into specific forecasts for your business, helping retail and finance companies optimize inventory and compliance, reducing risks by up to 25%.
Ultimately, automation doesn't just save you time. It gives you a competitive advantage that is priceless. Turn your data into your most insightful and reliable strategic advisor. With Electe, financial statement analysis finally becomes what it was meant to be from the start: the driving force behind your best decisions.
Here's what you need to remember from this guide to immediately turn data into concrete actions:
Balance sheet ratio analysis is not an academic exercise, but a powerful tool available to every SME to build solid and lasting growth. We have broken down the four pillars of analysis, discovering how each ratio is not just a number, but a piece of your company's story. You have understood that the real value lies not in the data itself, but in the context: comparing today's results with yesterday's and with those of your competitors transforms a figure into strategic insight.
The real turning point, however, is realizing that you don't have to do everything yourself, lost among spreadsheets and manual calculations. Switching to an intelligent platform like Electe is Electe longer a choice for the few, but a necessity for anyone who wants to remain competitive. This allows you to free up valuable time, eliminate the risk of errors, and receive forward-looking analyses that anticipate problems instead of reacting when it's already too late. Are you ready to stop looking at your data as mere numbers and start seeing it as strategic answers that drive growth? The next step is not to calculate another index. It is to start listening to what your data has been telling you for some time. Ready to turn your data into your biggest competitive advantage?

.svg)
.svg)
.svg)