In business, many decisions are still based on instinct or slow tests that change one variable at a time. Design of Experiment (DOE) is a structured statistical approach that overturns this paradigm. It allows you to test multiple factors simultaneously to efficiently discover which combinations lead to the best results, saving a huge amount of time and resources. In this guide, you will learn how to use design of experiment to transform doubts into evidence-based decisions, optimizing processes and campaigns with a scientific method that is finally within everyone's reach.
Imagine you want to perfect a cake recipe. The traditional approach, known as "one-factor-at-a-time" (OFAT), would be to first test different amounts of flour, keeping everything else constant. Once you find the "right" amount, you would move on to testing sugar, and so on. A long and, frankly, ineffective process.
This method is not only slow, but it also ignores a crucial element: interactions. Perhaps the optimal amount of sugar depends on the type of flour you use. The OFAT approach will never discover this synergy, leaving a potentially decisive improvement on the table.
This is where design of experiment comes into play. Instead of isolating variables, DOE guides you to vary them simultaneously, but in a planned and intelligent way. Not only is this method faster, but it also allows you to finally see how different factors influence each other.
The true value of design of experiment lies not only in understanding which factors matter, but in discovering how they work together to create the optimal result.
This structured approach transforms the decision-making process from a game of intuition to a data-driven science. It is a fundamental shift in mindset, enabling SMEs to innovate faster and with greater confidence.
Whether you are optimizing a marketing campaign, improving a production process, or developing a new product, the principles of DOE are universal. We will look at the fundamental statistical concepts explained in a simple way and analyze the different types of experimental designs to help you choose the right one. We will also explore how AI-powered platforms such as Electe, a data analytics platform for SMEs, make this process accessible to everyone by automating analysis and visualizing insights in a clear way. If you want to learn more about how big data analytics is changing businesses, you can explore our article on big data analytics.
To construct a solid building, you need a strong foundation. The same principle applies to design of experiments: if you want to obtain results you can trust, your approach must be based on three fundamental statistical pillars.
Don't think of complex formulas. These are actually logical concepts that ensure that the conclusions drawn from your data are accurate and not the result of chance. Understanding these three pillars—randomization, replication, and blocking—is the first step in turning any test into a powerful and credible experiment.
The first pillar is randomization. Imagine you want to test two different versions of an advertisement. If you show version A only in the morning and version B only in the afternoon, how can you tell whether the results depend on the ad or the time of day?
Randomization solves this problem. In simple terms, it means randomly assigning different experimental "recipes" (versions A and B) to the units you are testing (users). This ensures that any factors you cannot control—such as the time of day or the user's device—are distributed evenly across the groups. This way, any significant differences in results can be attributed with much greater confidence to the factors you are testing.
The second pillar is replication. Achieving a result just once is not enough. It could have been a mere coincidence. Replicating an experiment means repeating it several times under the same conditions. Each repetition is another opportunity to verify whether the observed result is consistent or an isolated case.
Replication is your insurance against chance. It helps you understand whether an effect is real and repeatable or just "statistical noise."
Consider an experiment in which you test a new page layout to increase signups. If the new layout wins with only one user, it means nothing. If it wins with 100 out of 120 users, then you have much stronger evidence. The more replicates you have, the more confidence you can place in your conclusions.
The third pillar isblocking. This technique allows you to manage those sources of variability that you are aware of but cannot eliminate. Imagine you want to test the effectiveness of two training methods on two groups of employees: newcomers and experts. Previous experience will certainly influence the results.
Instead of mixing everything together, you can use the block:
By doing so, you are comparing "apples with apples." The effect of training is measured within homogeneous groups, neutralizing the impact of variability due to experience. This makes it easier to detect real differences caused by the training methods themselves. Well-structured experimental designs can reduce the number of tests required by up to 75% compared to traditional approaches, while improving the accuracy of the results. To learn more, you can explore these techniques in detail in Design of Experiments.
Once you understand the statistical principles, the next step in design of experiment is choosing the right strategy. There is no universal recipe. The choice of experimental design depends on your objectives, the resources available, and how many variables you want to analyze.
Choosing the right method is like choosing the right tool: using the wrong experimental design can cause you to burn through your budget and time, or worse, lead you to make decisions based on incorrect conclusions.
The full factorial design is the most rigorous approach. With this method, you test every possible combination of the levels of all the factors you are studying. It is the ideal choice when you want a complete understanding of the system, including all possible interactions between variables.
Imagine you want to optimize a landing page with two headlines (A, B), two images (1, 2), and two calls to action (X, Y). A full factorial design would require 2x2x2 = 8 different tests to cover all combinations (A1X, A1Y, A2X, A2Y, B1X, B1Y, B2X, B2Y).
When you have many factors to analyze, a full design becomes a daunting task. That's where fractional factorial designs come in, a brilliant solution that allows you to test only a smart fraction of the total combinations.
The basic idea is that more complex interactions (between three or more factors) are almost always negligible. By focusing on the main effects and two-way interactions, you can get80% of the answers with 20% of the effort.
A fragmented design is a strategic compromise between depth of analysis and resources. It is perfect for an initial "screening" phase, to immediately understand which levers really matter.
For example, with 6 factors at 2 levels each, a full test would require 64 experiments. A fractional design could give you solid insights with only 16 or 8 tests.
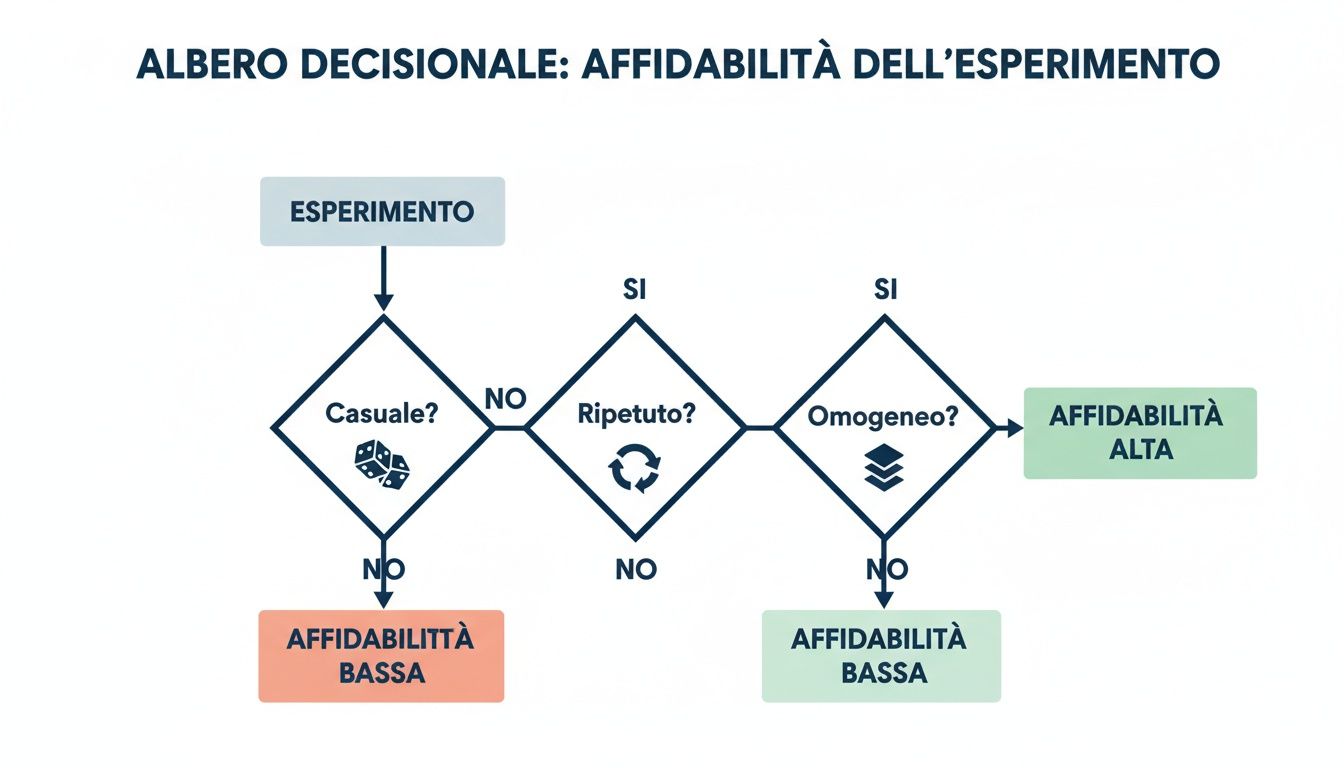
This simplified decision-making diagram shows how the principles of randomness, repetition, and homogeneity (achieved with blocks) are the foundation for the reliability of any experiment. Only by adhering to these three pillars can you be sure that your results are sound.
Once you have identified the most important factors, your goal changes. You no longer want to just know what works, but find the exact combination that maximizes a result. It's time to use Response Surface Methodology (RSM).
Think of RSM as creating a topographical map of your problem. Instead of testing only the extremes, RSM also explores the intermediate points to build a "surface" that shows how the response changes as factors vary. The goal? To find the "mountain top," the point of optimal performance.
Finally, block designs are a strategy that applies to the previous methods when you have to deal with a source of variability that you know about but cannot eliminate. If, for example, you have to conduct your tests on two different machines, you already know that this will introduce some "noise."
The solution is to create a "block" for each piece of equipment. Within each block, perform one version of your experiment. This way, the effect of the equipment is isolated and does not interfere with the effect of the factors you are really interested in.
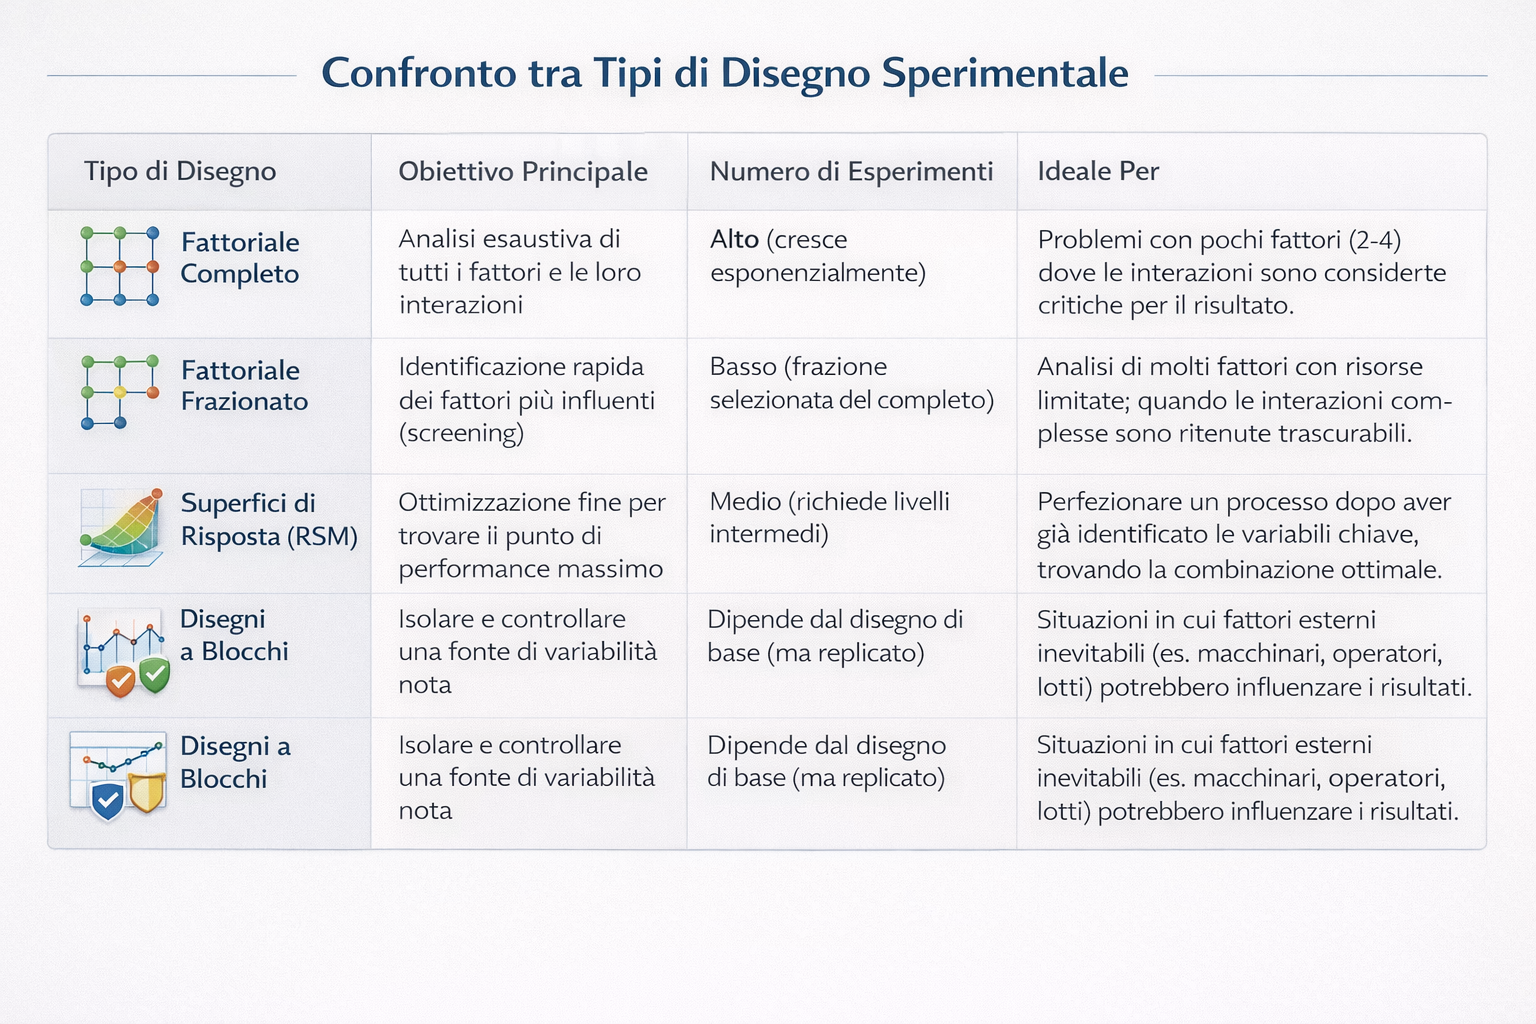
Comparison of the main experimental designs
This table helps you choose the right approach based on your objective.
Theory is useful, but its true power emerges when it translates into concrete business results. Design of experiments is not an abstract concept; it is a strategic tool that the most innovative companies use to make better decisions and accelerate growth.
Let's look at practical examples of how this approach transforms complex business problems into measurable opportunities.
Imagine an e-commerce company that wants to maximize the return on investment (ROI) of its campaigns. There are many variables, and testing them one at a time would be a never-ending process.
This is where the DOE comes into play. The team decides to use a factorial design to analyze three key factors simultaneously:
This creates 2x2x2 = 8 combinations to test. After launching the experiment, the company uses a data analytics platform to analyze conversion data. The analysis reveals an insight that a normal A/B test would never have uncovered.
The 20% discount, combined with the message "Free shipping," generates a 45% higher ROI when the campaign runs on social media. The same combination, however, produces only a +5% increase via email.
This insight allows e-commerce businesses to reallocate their advertising budget with precision, focusing the most powerful formula on the most receptive channel, with an immediate increase in ROI. This strategy is similar to the one we implemented to optimize BoxMedia's business processes, proving how data can drive smarter decisions.
Let's move on to the financial sector. A lending company wants to improve the accuracy of its credit scoring model to reduce the default rate. Less risk, more profit.
The team of analysts uses design of experiment to understand which applicant variables have the greatest impact on the probability of default. Three key variables to be tested are identified:
The data is processed through their data analytics platform. The results are illuminating:seniority has a much more pronounced effect on the risk of default for low-income customers, an interaction that the previous model underestimated.
This discovery allows the company to recalibrate its scoring algorithm, with an estimated 15% reduction in defaults over the following six months.
It's time to take action. Designing an experiment may seem daunting, but when you break it down into logical steps, it becomes a manageable and powerful process. This practical guide will walk you through creating your first design of experiment.

It all starts with a specific question. "I want to increase sales" is a desire, not a goal. You need something measurable. Ask yourself: what exactly do I want to improve? And how will I measure success?
Now that you have your goal, you need to figure out what levers you can pull. These are the factors: the variables you can control. For each factor, define the levels, i.e., the specific values you want to test.
For the previous objective, the factors could be:
A common mistake is wanting to test everything at once. Start with just a few levels for each factor (two or three is ideal) to keep the experiment manageable.
This is the stage where you decide on the "recipe" for your experiment.
We are at the crucial stage. Here, precision is everything. Data must be collected in a clean and consistent manner. Remember the key principles: use randomization to distribute any external influences evenly. If resources allow, perform replications to ensure that the results are not a fluke.
You have your data. Now what? Analysis helps you understand which factors had a significant impact, which interactions emerged, and what the winning combination is. This is where a platform like Electe can make a difference. Instead of getting lost in complex analyses, you can upload your data and let artificial intelligence do the heavy lifting, transforming raw data into intuitive graphs and ready-to-use insights. This approach is increasingly recognized: you can explore Istat's experimental statistics to see how it is applied at the national level.
Designing an experiment is only half the job. The other half, often the most challenging, is analyzing the data collected to gain useful business insights. This is where many companies get stuck, hampered by the need to use complicated statistical software.
Electe, our AI-powered data analytics platform, solves this problem. Instead of wasting hours on calculations, the platform connects to your data sources and automates the entire analysis process.
Our goal is clear: we want to make Design of Experiments a democratic tool, a strategic weapon that every manager can use to make better decisions based on concrete evidence.
With just one click, the Electe platform Electe advanced statistical analyses such as ANOVA (Analysis of Variance) and returns the results in the form of interactive, easy-to-read dashboards. This allows you to:
Electe the bridge that connects the raw data from your experiment to the strategic insights that drive growth. We take care of the complexity of analysis, so you can focus on your business.
The validity of this approach is also recognized in academia: courses in "Design of Experiment" are included in degree programs, such as those offered by the University of Bologna. If you are interested in this topic, you can find out more about the academic program. By leveraging AI-powered business analytics software, you can apply these same principles without first having to become a statistician.
We answer some of the most common questions about design of experiment to help you get started.
A/B testing is great for comparing two versions of a single variable (e.g., two headlines for an email). Design of experiment, on the other hand, gives you the power to test multiple variables simultaneously (headline, image, CTA) and, most importantly, their interactions, discovering the winning combination in much less time.
In theory, there are no limits, but in practice, efficiency is key. By leveraging smart designs such as fractional factorials, you can analyze a large number of factors (even 8-10 or more) with a manageable number of experiments. Modern platforms help manage this complexity efficiently.
No, not anymore. While understanding the basic principles helps, the days when you needed a PhD in statistics to apply DOE are over.
Today, AI-powered platforms like ours automate complex analyses and transform the results into insights that everyone can understand. This makes design of experiments a tool that is accessible to managers and analysts who want to make data-driven decisions.
Are you ready to turn your data into strategic decisions? With our platform, you can apply the power of design of experiment without the complexity. Start your free trial →

.svg)
.svg)
.svg)