Do the numbers in your financial statements seem like indecipherable code to you? If the answer is yes, you are not alone. Many SME managers look at their balance sheets and income statements and feel overwhelmed, ending up making decisions based more on gut feeling than on concrete data. This approach is not only risky, but it also hinders your company's growth potential.
The truth is that your financial statements are not just an accounting obligation, but a gold mine of strategic information. To extract this value, you need the right tools: financial statement analysis ratios. Think of them as an X-ray of your company: they transform complex tables into simple, straightforward indicators that measure financial health, profitability, and the ability to grow over time.
In this guide, we will show you how to use financial analysis ratios to ask the right questions of your data and get clear answers about the direction of your business. You will learn how to turn numbers from a problem into a compass for your strategic decisions.
The financial statements, with their tables full of numbers, may seem like a document only for accountants. In reality, they are a gold mine of strategic information. If you know how to read them, they can guide your every decision.
Balance sheet analysis by indices is precisely the process that allows you to extract this value. You don't have to become an accountant, but you do need to learn how to ask the right questions of your financial data in order to get clear answers about the direction your company is taking.
The goal here is not to memorize dozens of formulas. It is to understand what these numbers are telling you about your business. We will show you how financial ratios act as a compass, translating accounting complexities into insights you can use right away.
This concept map shows you the path: starting with raw data, you will explore the three fundamental areas of a company's health: liquidity, profitability, and solidity.
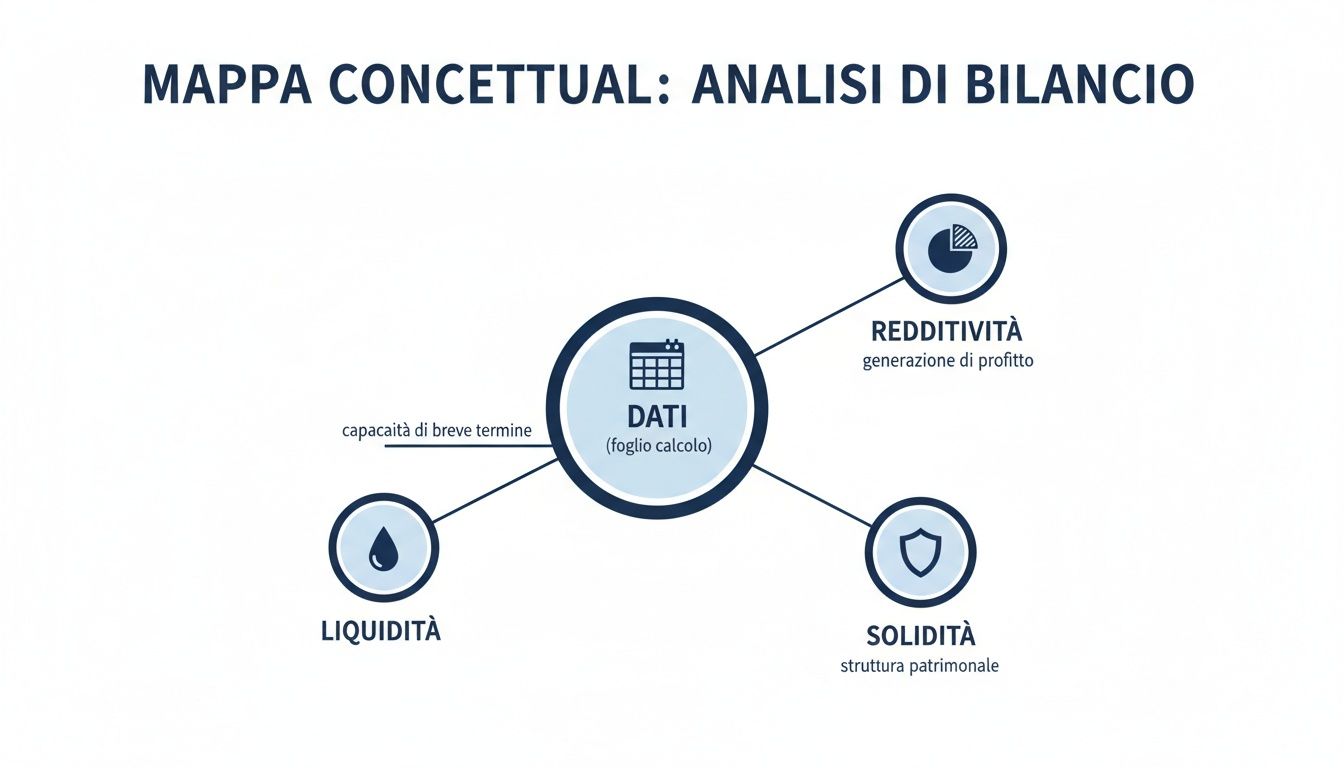
As you can see, each area addresses questions that are crucial to the survival and development of the business. The numbers, from simple figures, become a complete strategic vision.
Here is a map that allows you to understand your company's performance and stability at a glance.
Index Category Analysis Objective Strategic QuestionAddressed Liquidity Measurethe ability to meet short-term commitments. Do we have enough cash to pay salaries, suppliers, and taxes in the coming months?Profitability Assessthe ability to generate profits from sales and investments. Are we earning enough from each euro of sales? Are the investments we have made paying off?Financial Strength Analyzethe balance between sources of financing (debt vs. equity). Is our financial structure stable, or are we too dependent on banks?Operational Efficiency Checkhow effectively resources (inventory, receivables, payables) are being managed. Are we managing inventory and receivables well, or are we tying up valuable resources?
A thorough understanding of these dynamics means being able to anticipate challenges, seize hidden opportunities, and lead the company with the confidence that only deep financial awareness can provide. In an increasingly data-driven world, analyzing these large volumes of information becomes a competitive advantage. If you want to learn more, read our guide on how Big Data Analytics works.
It's time to stop guessing and start making clear-headed decisions. Financial statement analysis is the first step in transforming data from a simple accounting obligation into a driver of your growth.
As you continue reading, you will learn how to calculate and interpret the most important indices, with practical examples that you can immediately apply to your company.
Liquidity is the lifeblood of your business. You may have the best product in the world and growing sales, but if you don't have enough cash to pay salaries and suppliers, even the most profitable business risks suffocating.
This section focuses precisely on this vital aspect: your SME's ability to meet its financial commitments in the short term, typically within 12 months. We will take a very practical look at the two key indicators that every manager should always keep an eye on.

The current ratio is the first and most immediate indicator of short-term financial health. It answers a very simple question: "Are my short-term liquid resources sufficient to cover my short-term debts?"
In practice, it compares everything that will be converted into cash within a year ( Current Assets) with everything that will have to be paid within the same period ( Current Liabilities).
The formula is straightforward:
Formula: Current Ratio = Current Assets / Current Liabilities
Current Activities include items such as:
Current liabilities, on the other hand, include items such as:
How should it be interpreted? A result higher than 1 means that, on paper, your company has enough resources to cover its commitments. If the value falls below 1, it is a serious warning sign, because it signals a potential liquidity crisis. In general, a value considered "healthy" is between 1.5 and 2, but this figure must always be contextualized to your sector.
A current ratio of 1.8 may be excellent for a manufacturing company with a large inventory, but perhaps excessive for a consulting firm that has few inventories and collects payments very quickly.
The Current Ratio has a limitation: it considers liquid inventory to be as liquid as cash. But let's be honest: what happens if your warehouse is full of products that are difficult to sell quickly without discounting them?
This is where the Quick Ratio comes into play, also known as the "Acid Test" due to its severity. This indicator gives you a much more cautious and realistic view of liquidity, because it excludes the least liquid component of all from the calculation: inventory.
The formula is adjusted accordingly:
Formula: Quick Ratio = (Current Assets - Inventories) / Current Liabilities
This ratio measures your company's ability to meet short-term debts using only its most liquid resources, such as cash and receivables nearing maturity.
How should it be interpreted? For the Quick Ratio, a value equal to or slightly higher than 1 is generally considered an excellent sign of balance. It tells us that your company can pay its short-term debts without necessarily having to rush to sell its inventory.
Practical comparison example
Imagine Rossi S.r.l. with the following data:
We calculate the two balance sheet analysis indices on liquidity:
Using these two indicators together provides a much more comprehensive view. It allows you to understand not only whether you have enough liquidity, but also how much your ability to pay debts depends on an asset, inventory, which is not always easy and quick to convert into cash.
Of course, having the money to pay the bills is vital. But a company's real mission is something else: to generate profits. Profitability isn't just a number at the bottom of the balance sheet at the end of the year; it's the thermometer that measures the effectiveness of your business model and your ability to create lasting value.
This section is dedicated to those financial statement analysis ratios that reveal a company's ability to generate profit. We will take a close look at the indicators that tell you, in no uncertain terms, how efficient your company is in using its resources to produce wealth.

ROI, or Return on Investment, is one of the most powerful indicators you can have. It answers a question that is as simple as it is crucial: "How much does every single dollar I have invested in the business generate, regardless of how I financed it?"
In practice, it measures the health of your core business. A high ROI means that your company is a well-oiled machine, capable of transforming investments (in machinery, technology, raw materials) into profit.
Its formula is quite straightforward:Formula: ROI = Operating Income (EBIT) / Net Invested Capital
Operating income (EBIT) is profit before interest and taxes, while net invested capital is everything needed to run the business.
What does a 15% ROI mean? It means that for every $100 you invested, your management generated $15 in profit. This is the first, fundamental check to understand whether your business is "viable" at an operational level.
While ROI reflects the profitability of the company as a whole, ROE, or Return on Equity, changes perspective and puts itself in the shoes of the owners. This index tells you how much return the capital that the shareholders have risked by investing in the company is generating.
This is the indicator that investors are most interested in, because it measures the actual return on their personal investment. It answers the question: "Is it worth it?"
The formula is as follows:Formula: ROE = Net Profit / Shareholders' Equity
A ROE of 12% means that every €100 of capital paid in by shareholders generated €12 in net profit at the end of the year.
A practical tip: always compare your ROE with the return on alternative investments. If your company's ROE is lower than the return on a government bond, shareholders may start to question the validity of the risk.
Be careful, though, ROE can be a double-edged sword. A company that makes heavy use of debt (known as financial leverage) can inflate its ROE, but it is also increasing its risk exponentially.
Finally, we come to ROS, or Return on Sales, which focuses purely on commercial efficiency. It answers a straightforward question: "For every euro I invoice, how much operating profit do I have left in my pocket?"
This index measures the actual profitability of your sales. A high ROS is an excellent sign: it means that you are keeping production costs under control and that your pricing strategy is working.
Calculating it is simple:Formula: ROS = Operating Income (EBIT) / Sales Revenue
If your ROS is8%, it means that for every $100 worth of products or services you sell, after covering all operating costs, you are left with $8 in profit. This value is essential for understanding how competitive you are in the market.
These economic indicators, which are crucialin index-based budget analysis, do not exist in a vacuum. According to Istat, GDP growth of 0.5% and inflation of +1.0% are estimated for 2024 . These contextual data influence costs and revenues, and consequently profitability . For those who want to learn more, Istat's 2025 Budget Forecast offers a complete picture.
Analyzing ROI, ROE, and ROS together gives you a three-dimensional view of your ability to make a profit. It helps you understand not only whether you are making money, but more importantly, how and where you are creating value. Is it thanks to efficient investment management (ROI)? Effective financial leverage (ROE)? Or solid sales margins (ROS)?
How solid is your company? This question goes far beyond simply asking, "Can I pay my bills when they are due?" Here, we get to the heart of long-term stability, trying to understand how the company finances itself and whether its level of debt is sustainable over time.
Capital structure ratios, a pillarof ratio analysis, serve precisely this purpose. They tell you whether growth is built on solid foundations or on a house of cards ready to collapse at the first gust of wind.

The first indicator to examine isthe debt ratio, better known as leverage. It answers a very direct question: to keep the business going, do you rely more on money from shareholders or from banks?
In practice, it measures the ratio between borrowed capital (total liabilities) and equity capital (net assets). It is a gauge of your financial dependence on external parties.
The formula is simple:Formula: Leverage = Total Liabilities / Net Assets
Interpreting the result is fairly intuitive:
A value slightly above 1 may be a conscious strategy to accelerate development, but when it exceeds 2, alarm bells start ringing. It means that debts are double the capital invested by shareholders, and the financial risk begins to be felt quite significantly.
This concept of balance, incidentally, does not only apply to businesses. Public finances also depend on careful debt management. According to the Parliamentary Budget Office, Italy's deficit is expected to fall to 2.9% of GDP in 2025. This is a sign of improvement which, as you can read in their recent report on public finances, indicates a strengthening of fiscal governance.
Having debts is not a sin in itself. The real problem is not being able to repay them. And this is wherethe Interest Coverage Ratio comes into play.
This ratio tells you whether you are able to pay the interest on your debt using the profits you generate from your normal business activities. It is a favorite indicator of banks and creditors because it measures the sustainability of your debt here and now. In other words, it tells you how many times your operating income can "cover" your financial expenses.
The formula is as follows:Formula: Interest Coverage Ratio = Operating Income (EBIT) / Financial Expenses
The higher the result, the better. A value of 5, for example, means that for every euro of interest payable, your company has generated €5 in operating profit. A very comfortable safety margin.
Please note: a value below 1.5 is already considered risky. Even a small decline in profits is enough to put the company in serious difficulty with interest payments, with consequences that can become very serious.
Combined practical example
Let's put the pieces together. Let's take Bianchi S.p.A. with these balance sheet figures:
Now let's calculate the two balance sheet analysis indices we just saw:
The combined analysis gives you a clear and comprehensive overview. Bianchi S.p.A. is using debt to finance its growth (Leverage > 1), but it is doing so in a sustainable manner because it generates operating profits that are more than sufficient to cover the costs of that debt. It is precisely this balance that is the secret to healthy and lasting growth.
Calculating financial ratios by hand is a slow, tedious, and error-prone task. One typo, one wrong formula, and the entire analysis is useless. For an SME that needs to move quickly, this manual approach is no longer a choice, but a limitation.
Here, artificial intelligence has changed the game. It has transformed a process that used to take precious hours into an instant competitive advantage. Instead of wasting time extracting data, checking formulas, and formatting spreadsheets, you can have everything you need in seconds. And it's not just a matter of time saved, but of the quality of your decisions.
AI-powered data analytics platforms, such as Electe, have literally revolutionized the way financial analysis is done. It is no longer a matter of manual work on numbers, but rather a dialogue with data. The system connects directly to your accounting sources—whether it's your management system or a simple Excel file—and does all the heavy lifting for you.
In practice, it works like this:
This frees you from low-value activities and finally allows you to focus on what matters: strategy.
The real magic of AI is not calculating faster, but discovering connections and trends that the human eye alone would never see. It's the difference between consulting an old paper map and using a satellite navigation system that alerts you to traffic in real time.
Here is an example of a dashboard generated by Electe.
This isn't just a snapshot of your key KPIs, such as ROI and ROS. It's a movie. It puts the data into perspective, compares it with historical data, and lets you see immediately whether you're heading in the right direction or whether a red light has come on.
Imagine you need to prepare a detailed analysis for your next meeting with shareholders or the bank. With platforms such as Electe, it no longer takes hours, but literally just one click.
The point is not just to have the correct numbers. It's to have already interpreted them. The platform doesn't just give you the data, it puts it into context. For example, it can automatically compare your ROS with the industry average, telling you immediately whether your margins are healthy or whether you are losing ground to your competitors.
It's a total paradigm shift. You no longer have to "query" the data to find answers; the platform itself brings you the right questions (and often the answers) right before your eyes. This ability to anticipate information needs is at the heart of modern decision support systems, which are becoming true virtual advisors for management.
But the real leap forward that AI bringsto index-based financial statement analysis is its ability to look beyond the rearview mirror.
Machine learning algorithms, such as those used by Electe, can:
Financial statement analysis ceases to be a tool for analyzing the past and becomes a compass for guiding the future. Every SME manager can now have access to computing and analytical power that, until yesterday, was a luxury reserved for large companies with entire teams of dedicated analysts.
You have explored the world of financial ratios. Now it's time to translate theory into concrete actions that you can implement right away to improve the management of your SME.
We have reached the end of our journey through financial statement analysis ratios. You have discovered that they are not just numbers for accountants, but real strategic advisors that tell you the story of your company, day after day. Used correctly, they allow you to move from instinct-based decisions to choices supported by concrete data.
The real breakthrough, however, lies not in the individual indicator, butin the combined and continuous analysis over time. It is by observing how the indices evolve that you can discover trends, anticipate problems, and confirm the effectiveness of your strategies.
Today, you no longer have to face this challenge alone. Technology has made this process accessible to every SME, transforming it from a complex burden into a powerful competitive advantage. An AI-powered platform like Electe crunch the numbers, it changes the way you interact with data, shifting the focus from "how do I calculate this" to "what do I do with these insights?"
It's time to stop viewing your budget as a chore and start seeing it as the engine of your growth.
Ready to turn your data into strategic decisions? Discover how Electe illuminate your decisions.
We have navigated the world of financial ratios together, but it is normal for doubts and concerns to arise in everyday practice. Here we answer the most common questions that entrepreneurs and SME managers ask themselves, to help you use these tools with even greater confidence and effectiveness.
For management that doesn't just react to problems but anticipates them, quarterly analysis is the ideal frequency. It gives you a feel for the situation, allowing you to spot trends and anomalies early enough to take action before a small crack becomes a chasm. Annual analysis remains the bare minimum, but in a fast-moving market, it is often like looking in the rearview mirror to decide where to turn next.
Absolutely not. A single indicator that falls outside the norm is a warning sign, not a definitive judgment. Its true significance only emerges when you place it in the broader context, looking at other indices, the company's historical trends, and what is happening in your sector. For example, a low liquidity ratio may be less worrying if the company is generating excellent profits (high ROS) and has a solid order book. The big picture is everything.
Without a comparison with the sector (benchmark), your numbers remain meaningless. How do you know if your 10% ROI is a triumph or a missed opportunity? Benchmarking gives context and meaning to your results. The main sources for this comparative data are chambers of commerce, financial databases, or, more simply, analytics platforms such as Electe, which integrate these comparisons automatically.
In addition to falling into the trap of analyzing an index in isolation, there are other classic pitfalls that can lead you to completely wrong conclusions.
Here are three to always keep in mind:
Automation saves you from calculation errors, but strategic interpretation always requires a critical eye and full awareness of the context in which your company operates.

.svg)
.svg)
.svg)