Key performance indicators (KPIs) in marketing are the compass that guides your strategies toward your business goals. They are not just numbers, but precise indicators that transform a sea of data into clear signals. In a nutshell, they tell you whether you are winning or losing, allowing you to make decisions based on concrete evidence rather than intuition. This gives you the power to invest every dollar of your budget where it really counts, transforming marketing from a cost center into a measurable growth engine. In this guide, you will discover how to choose, measure, and analyze the KPIs that really make a difference for your SME.
Imagine driving a car without a dashboard. You wouldn't know how fast you're going, how much gas you have left, or if there's a problem with the engine. You'd be forced to drive blind, hoping to reach your destination. In the business world, navigating without data is just as risky.
Key Performance Indicators (KPIs) are the dashboard of your marketing strategy. They give you a clear and immediate view of performance, allowing you to correct course in real time and justify every investment.
The terms "metrics" and "KPIs" are often used interchangeably, but there is a significant difference between them. Understanding this difference is the first step toward building a marketing strategy that truly works.
A metric is any data that can be counted. Think of "likes" on an Instagram post, page views on a website, or the number of followers. These numbers are useful, but they don't tell the whole story on their own.
A KPI, on the other hand, is a metric that you have carefully chosen because it directly measures progress toward a key business objective. It is not just a number; it is a strategic compass.
An effective KPI does more than just measure an activity; it measures the outcome of that activity in relation to a business objective. It is the bridge that connects marketing actions to business results.
For example, if your goal is to generate more qualified leads, website traffic is a metric. A KPI, on the other hand, would be your landing page conversion rate or Cost per Lead (CPL). Why? Because these numbers tell you exactly how effective your strategy is in achieving your goal.
For small and medium-sized enterprises (SMEs), where every resource counts, distinguishing between "noise" (vanity metrics) and "signal" (meaningful KPIs) is a matter of survival and growth.
Focusing on the right key performance indicators in marketing allows you to:
Ultimately, KPIs transform marketing from a cost center to a measurable growth engine, giving you the clarity you need to navigate today's competitive marketplace with confidence.
Choosing the right KPIs is not like picking random numbers from a list. It is a strategic process that always starts with your business objectives. If you don't know where you want to go, no indicator will ever tell you if you are on the right track. The most common mistake is to be seduced by "vanity metrics."
Vanity metrics are numbers that look good but say little or nothing about your business. We're talking about "likes" on a post or page views. They're easy to measure and give a pleasant feeling of progress, but often have no direct link to the actual growth of your company.
True value emerges when you translate a concrete business goal into a measurable performance indicator. Instead of saying "I want more traffic to the site," your goal should become "I want to increase qualified leads by 15% in the next quarter." This clarity transforms marketing into a true growth engine.
To avoid getting lost in a sea of useless data, use the SMART framework. This approach helps you define objectives (and consequently KPIs) that are Specific, Measurable, Attainable, Relevant, and Time-bound (Timed).
Let's see how it works with a practical example for an SME:
Now let's apply the SMART criteria to define the KPIs that will guide you:
KPIs are not set in stone. They are dynamic tools that must evolve alongside your business objectives. What is crucial today may only be a supporting metric tomorrow.
This process transforms a generic ambition into a clear mission, with precise indicators that tell you exactly how you are progressing.
Each marketing objective requires a different set of key performance indicators. There is no magic formula that works for everyone. If your focus is on brand visibility, you will concentrate on reach metrics; if, on the other hand, you are looking for sales leads ready to buy, cost per lead becomes your guiding light.
Here are some classic combinations:
In Italy, where digital marketing is booming, measuring campaign effectiveness has become vital. ROI (Return on Investment) remains the most direct measure of success. For example, Italian companies that invest in search marketing aim for an average ROI of around 250%. You can find more insights on marketing KPIs at ClickUp.com. This figure is not just a number: it shows how choosing a KPI such as ROI can validate your strategy and justify every cent invested.
A customer never buys on first contact. Their journey involves several stages, each with specific objectives and challenges. To guide them effectively, you need a map, and this map is built on the right key performance indicators in marketing for each stage of the journey.
Treating all visitors the same is like giving the same medicine to patients with different symptoms: it doesn't work. Every moment of the customer journey, from discovery to loyalty, requires a specific set of indicators to understand if you are heading in the right direction.
The goal here is simple: capture the attention of potential customers who don't know you yet. You're casting a wide net to stand out from the noise of the market. At this stage, you're not selling anything, you're just saying, "Hey, I exist and I might have something you're interested in."
To measure your visibility, the key KPIs are:
This image shows how each business objective translates into specific KPIs to measure progress.
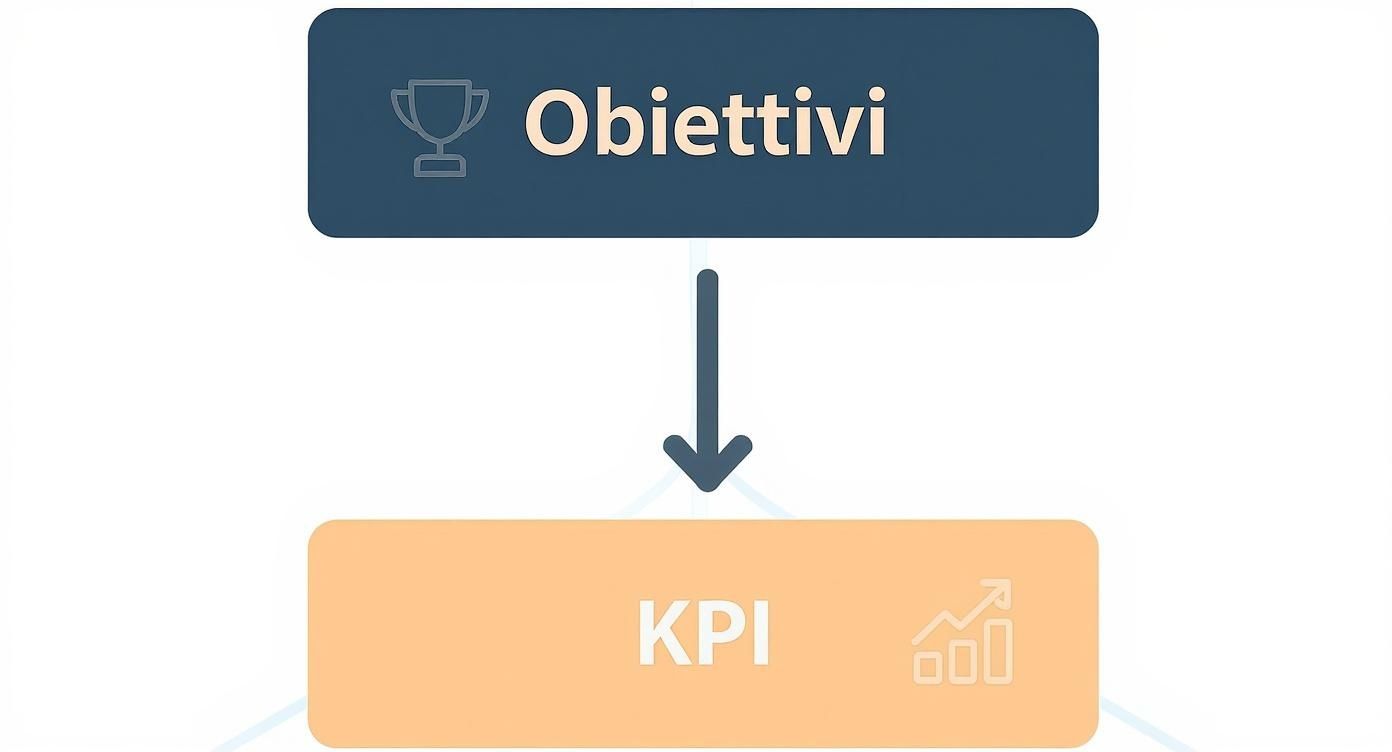
As you can see, a KPI is not an isolated number, but a tool that links an action to a strategic result, creating a clear bridge between what you do and the goal you want to achieve.
Once you have captured their attention, the challenge changes: you must keep their interest alive and prove your worth. At this stage, the potential customer is evaluating their options, comparing you with your competitors, and trying to understand whether your solution is the right one for them.
To measure your engagement, focus on these KPIs:
With digital advertising spending in Italy reaching €5.9 billion, an increase of8.4%, competition for attention is fierce. The most active sectors, such as industry (22.4%) and retail (9.2%), rely on KPIs such as CTR to optimize every single euro invested.
This is the moment of truth. The goal is to turn an interested visitor into a lead or, even better, a paying customer. Every previous action converges toward this point.
The KPIs that really matter here are these:
Acquiring a customer is just the beginning. True long-term growth comes from retaining the customers you already have, turning them into repeat buyers and advocates for your brand. They cost much less than new ones and, over time, tend to spend more.
To measure loyalty, keep an eye on these indicators:
Mapping KPIs along the customer journey gives you an overview, allowing you to identify precisely where you are excelling and where there are bottlenecks to resolve.
This structure gives you full control over every stage of the process, transforming data from simple numbers into a real strategic guide for growth. For more information on the most specific key indicators for the sector, we recommend consulting the guide on the 13 most commonly used KPIs for marketing and communication.
Having a well-defined list of key performance indicators in marketing is only the first half of the game. The real challenge, the one that separates those who achieve results from those who merely collect numbers, lies in the ability to measure, analyze, and, above all, interpret them.
Without this crucial step, your KPIs remain inert numbers on a spreadsheet, unable to show you the right path. But the good news is that you don't have to become a data analyst to do this. Today, there are tools and approaches that make data collection an almost automatic process, leaving you time for the most valuable activity: strategy.
To start tracking your KPIs effectively, you need a basic arsenal. Each tool will provide you with a piece of the puzzle, a specific view of one part of your marketing ecosystem.
Used together, these tools give you a complete picture. The problem? Data often remains isolated, locked away in silos that don't communicate with each other.
To take a leap forward and calculate more sophisticated KPIs, those directly linked to turnover such as Customer Lifetime Value (LTV) or Customer Acquisition Cost (CAC), you need to combine marketing data with sales data. This is where CRM (Customer Relationship Management) comes into play.
A CRM is not just a digital address book. It is the beating heart that connects marketing actions to sales results, allowing you to calculate the true ROI of every single activity.
Unfortunately, many companies have not yet seized this opportunity. In Italy, although 65% of SMEs invest in digitization, only 17.2% of companies with fewer than 10 employees use a CRM. This is a huge gap that limits the ability to analyze the most strategic key performance indicators in marketing. You can learn more about these figures on the digital divide among Italian SMEs at AgendaDigitale.eu.
A number alone doesn't mean anything. Is a 2% conversion rate good or bad? It depends. If you sell luxury yachts, it's a stellar result. If you sell coffee, something's probably wrong. Context is everything.
To interpret your KPIs correctly, you need to do two fundamental things:
As data sources increase, analysis can become complex. To understand how to unify and make sense of large volumes of information, we recommend our guide to Big Data Analytics and its impact on business. It's the approach that allows you to uncover the insights that really make a difference.
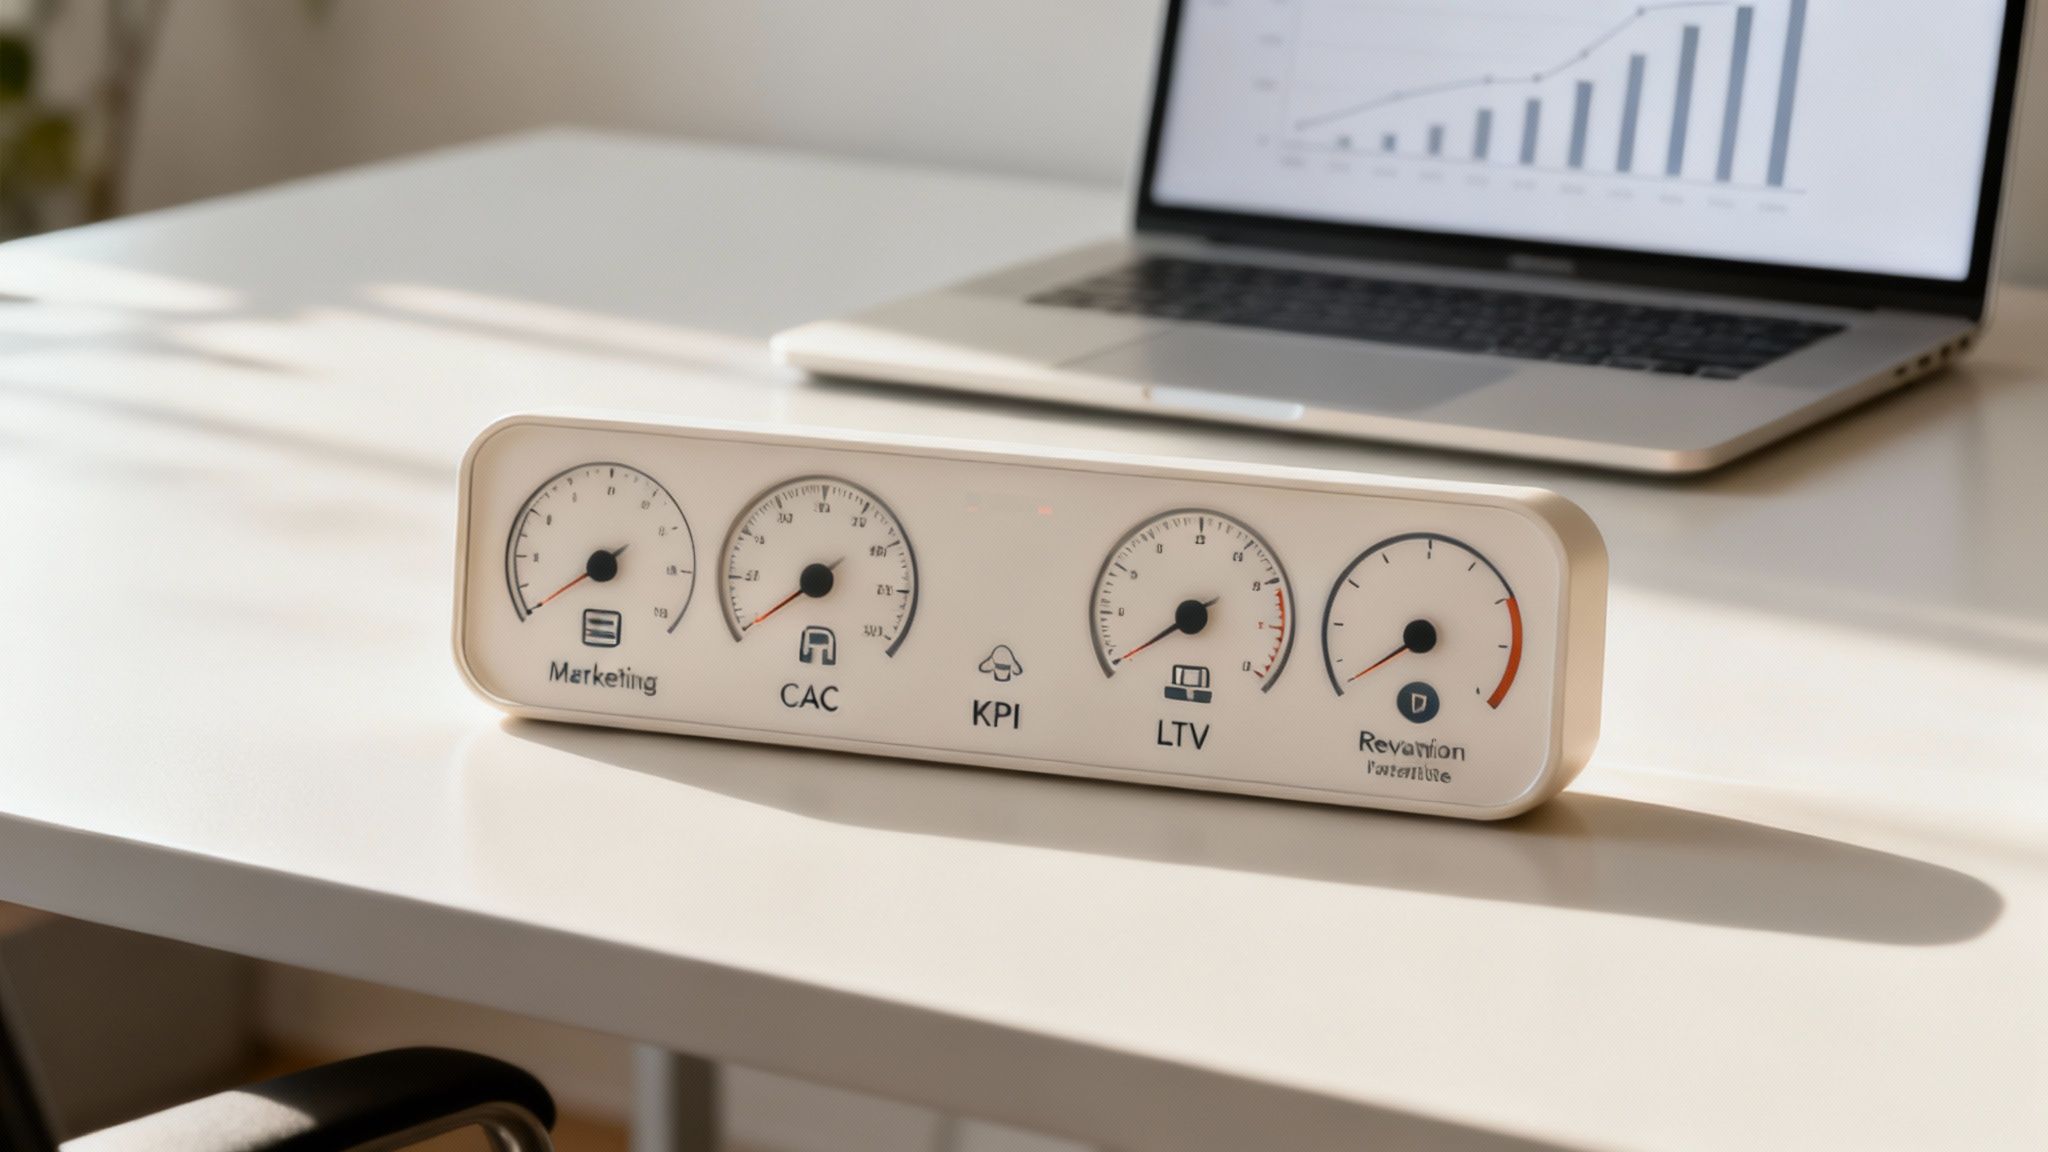
Data scattered across a thousand spreadsheets is useless. To make quick, informed decisions, you need a clear, immediate overview of your most important marketing key performance indicators. This overview is called a dashboard.
An effective dashboard is not just a collection of graphs, but a visual story that answers specific business questions. It is the bridge that connects raw numbers to strategic decisions, transforming complex data into a language that anyone can understand, from the CEO to the social media manager.
The secret to a good dashboard lies in customization. Not everyone in the company needs the same information, and this is where many people go wrong. Creating a single dashboard for everyone is a common mistake that makes it irrelevant to most people.
To be truly useful, it must be written with the reader in mind:
Adopting this approach ensures that each team member receives only the information they need to take action, without being overwhelmed by data that is not relevant to them.
Designing the perfect dashboard is only the first step. The real problem, especially for many SMEs, is the manual work required to populate it: extracting data from Google Analytics, CRM, social media, and laboriously combining it all in one place. It's a slow, tedious process and, worse still, one with a high risk of errors.
This is where a platform like Electe comes in. Our AI-powered data analytics platform revolutionizes this process for SMEs by automatically connecting to all your data sources.
Check out this example of a dashboard created with Electe.
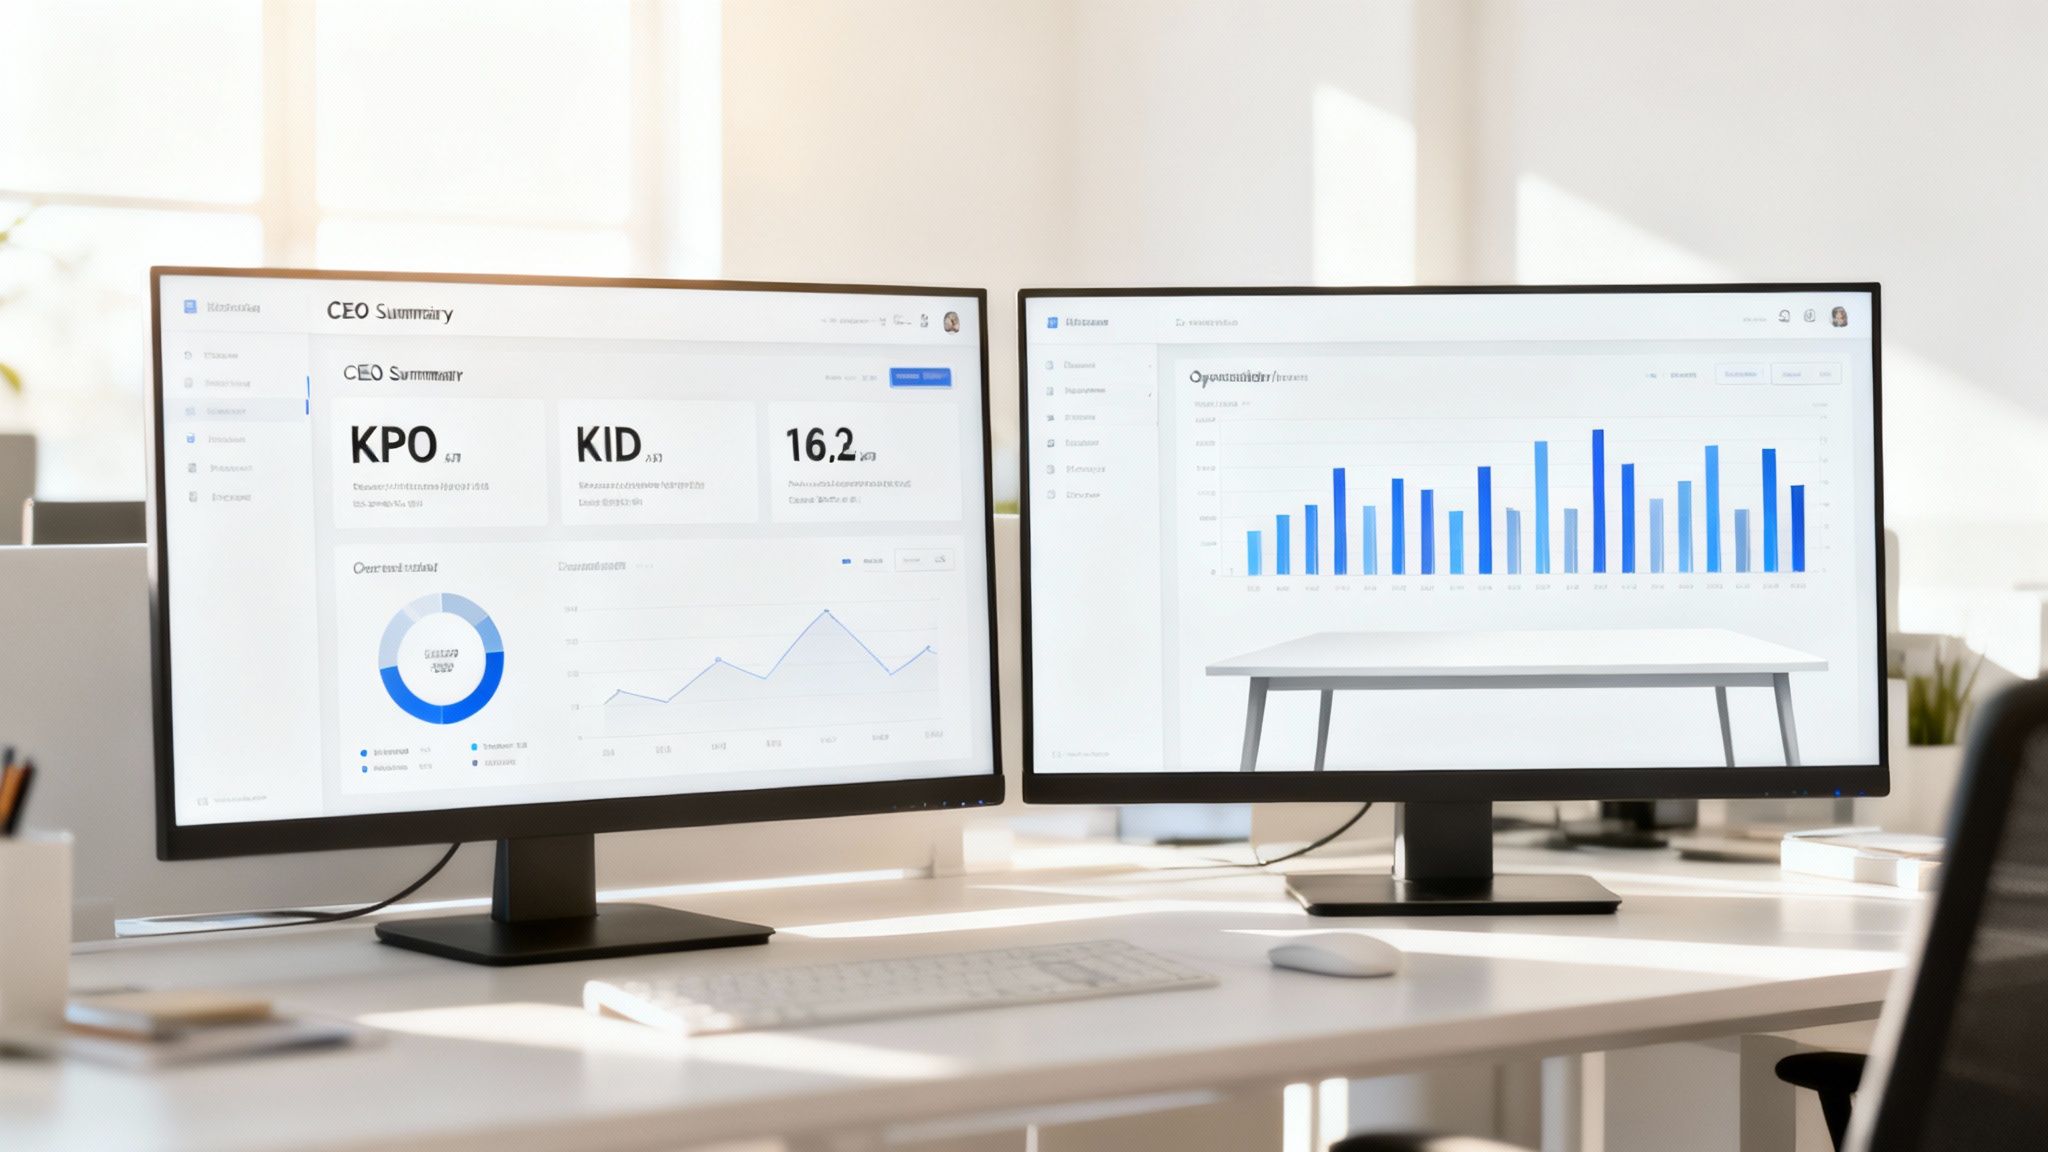
Instead of scattered data, you get a unified view that updates in real time. This allows you to monitor KPIs such as traffic, conversions, and ROAS in a single, convenient dashboard.
But the real advantage goes beyond that. Electe display data. Our platform uses artificial intelligence to analyze trends, highlight anomalies, and suggest strategic actions. For example, it could alert you that the CAC of a specific channel is increasing abnormally, advising you to review your investment. In this way, your dashboard is transformed from a simple reporting tool into a true strategic advisor for growth. To find out how to build your own, read our guide on how to create analytical dashboards on Electe.
We have reached the end of our journey into the world of key performance indicators in marketing. Now it's time to sum up and distill the key concepts that you can put into practice right away to shift gears.
The starting point is always the same: every single KPI you monitor must be linked to a concrete business objective. Set aside vanity metrics that stroke the ego but don't deliver results, and focus on what measures real growth. We're talking about indicators such as Customer Acquisition Cost (CAC) or Customer Lifetime Value (LTV).
Data-driven marketing is no longer a luxury. Today, it is a necessity for any SME that wants to grow intelligently and sustainably.
A single piece of data is just a number. It has no history, no meaning. Analysis without context is a useless exercise. It is essential to compare your results over time to identify trends and measure your performance against industry benchmarks. Only then can you understand whether that 3% conversion rate is a triumph or a missed opportunity.
Don't drown in a sea of spreadsheets. The real challenge isn't collecting data, but interpreting it to make decisions that make a difference. That's where smart tools that automate information collection and visualization come in.
A platform such as Electe, for example, can change the rules of the game. By automating the creation of reports and dashboards, you free up valuable time. Time that you can finally devote to what you do best: driving the growth of your company.
If you want to better understand how the right tools can unify your strategic vision, I recommend taking a look at business intelligence software solutions that help transform data into clear decisions. Choosing the right technology is the first, fundamental step toward marketing that really works.
At this point, you should have a much clearer idea of how key performance indicators in marketing can drive your growth. However, it is normal to still have some practical questions.
Here you will find answers to the most common questions that SMEs like yours ask themselves every day. No theory, just practical advice on how to overcome the most common obstacles.
Imagine you are the coach of a soccer team. The metric is the total number of shots taken during a game. It's a statistic, but on its own it doesn't tell you much. Did they shoot from midfield? Did they hit the goalkeeper?
The KPI, on the other hand, is the percentage of shots on target. This is a key indicator because it directly links the action (the shot) to a crucial objective (scoring a goal).
The same applies to marketing: the number of visitors to a website is a metric. The conversion rate of those visitors into customers is a KPI, because it links traffic to an economic result.
The short answer is: it depends. Treating all data equally is a mistake that costs time and causes opportunities to be missed. Not all indicators have the same urgency.
Here is a rule of thumb:
Even the most experienced teams fall into certain traps. Knowing them in advance is the best way to build a measurement system that really works.
The biggest mistake is using data just to fill reports, rather than to make decisions. A KPI is a tool for action, not a number to be filed away.
Here are three missteps to watch out for:
There is no magic number, but the golden rule is always "less is more." Clarity always beats quantity.
For an SME, an incredibly effective approach is to focus on 5-7 key KPIs. These should cover the different stages of the customer journey (discovery, evaluation, purchase, loyalty). This small set of indicators ensures you stay focused, prevents you from getting lost, and makes dashboards understandable to the whole team, not just marketers.
Ready to turn your data into strategic decisions? With Electe, you can automate your KPI analysis, create interactive dashboards, and receive AI-powered insights to accelerate your growth. Start your free trial →

.svg)
.svg)
.svg)