Every strategic decision that can make the difference between growth and stagnation is based on clear data. But how can you turn a cold list of numbers into a roadmap for success? The answer lies in your chart of accounts, the very DNA of your company's accounting.
All too often, the chart of accounts is seen as a mere bureaucratic requirement, a nuisance to be delegated to the accountant. The truth is that it is the most powerful tool you have at your disposal to monitor the financial health of your SME, optimize resources, and, ultimately, make fact-based decisions.
A well-organized accounting structure is not an obligation; it is the engine of your growth. It allows you to understand exactly where every single euro goes, which activities generate profit and which are just a cost, enabling you to plan for the future with a confidence you didn't have before. This clarity brings tangible benefits, supported also by the Italian regulatory framework, which pushes towards greater structuring and transparency.
In this guide, we will show you how to:
At the end of this journey, you will no longer see this structure as a burden, but as an irreplaceable strategic resource, especially when you understand how to integrate it with the power of data analysis. If you want to take a leap into the future, read our comprehensive guide to Big Data Analytics.
Imagine the chart of accounts as an architect's library: orderly, logical, and functional. Each book is a financial transaction, and just like in a well-designed library, each volume has its own shelf and label. It is not a random order, but a system designed to help you find the information you need right away.
This entire architecture rests on two pillars, the two main sections of your accounting library: the Balance Sheet and the Income Statement. Each answers a different question, but both are vital to understanding the health of your business.
Think of the balance sheet as a snapshot of your company taken at a specific moment in time, usually December 31. This image does not tell a story over time, but captures the exact financial balance, showing what the company owns and what it owes.
It is divided into three main categories:
If the balance sheet is a photograph, the income statement is a film. It tells the operational story of your company over a period of time, typically the fiscal year. Its purpose is straightforward: to understand whether you have generated a profit or incurred a loss.
There are two main characters in this film:
The plot is simple: if revenues exceed costs, the end result is a profit. If, on the other hand, costs have been higher, a loss is recorded.
The chart of accounts is not just a list of codes; it is the grammar of business language. It transforms raw data into clear narratives, allowing you to read your company's financial history and write its future.
This diagram clearly illustrates how the chart of accounts acts as a bridge, transforming individual daily transactions into strategic decisions.
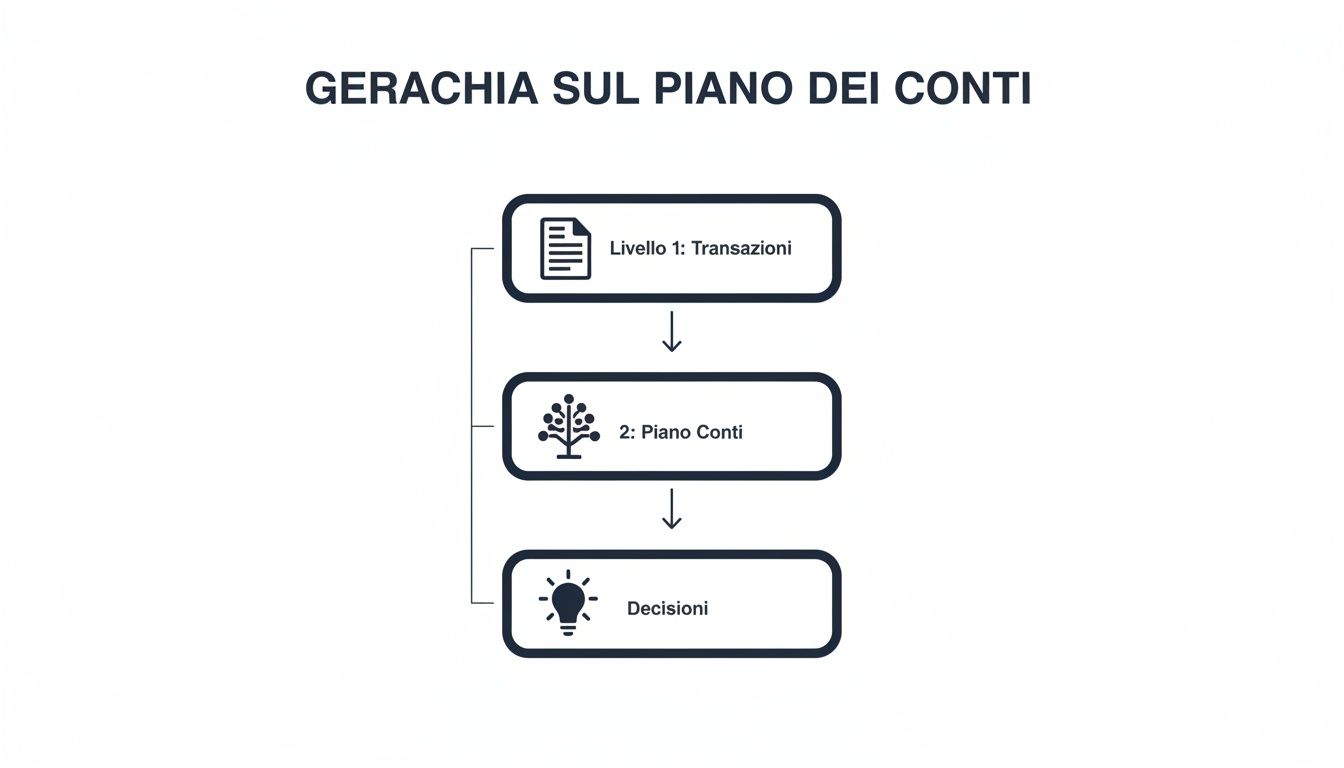
Each accounting document is a piece that feeds into the system, which organizes the data to produce clear analyses, ready to be used in your decision-making process.
Have you ever wondered why every account has a numerical code? It's not to complicate things, quite the contrary. It follows a hierarchical logic that allows you to navigate from the most aggregated data to the most detailed with disarming ease.
Generally, the structure is divided into several levels, like a family tree:
It is precisely this cascade system that makes the chart of accounts such a powerful analysis tool. It allows you to get an overview of the financial situation and then, with a click, "zoom in" on a single cost to understand its origin and impact. It is the DNA of every report and analysis that really matters.
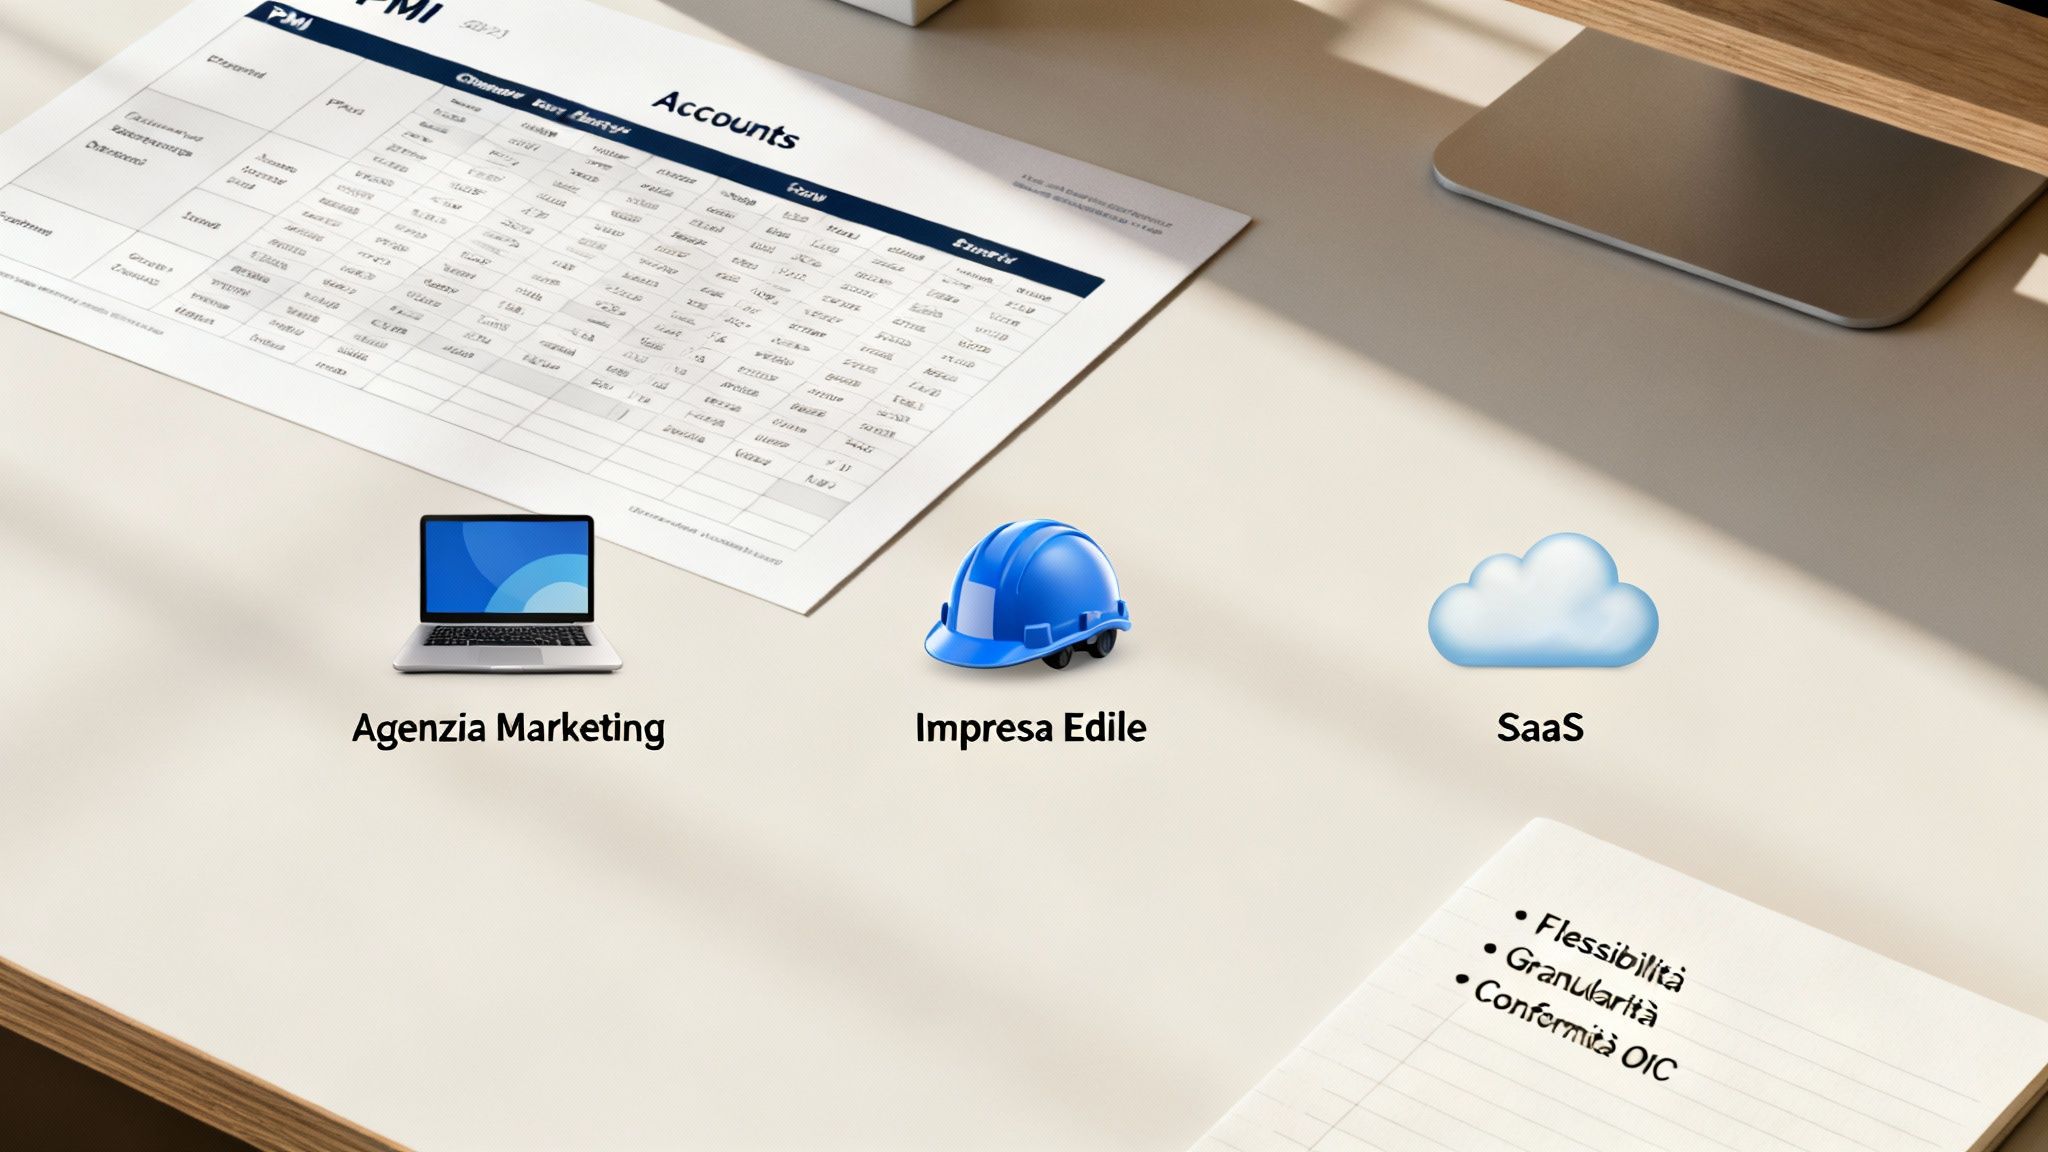
A chart of accounts is not a one-size-fits-all solution. The needs of a digital marketing agency and those of a construction company are polar opposites. Adopting a standard template without customizing it is like trying to navigate a complex city with a generic tourist map: it gives you an idea of the direction, but it will never help you discover shortcuts or avoid closed roads.
The true power of this tool only emerges when you tailor it to the specific needs of your business. A customized chart of accounts allows you to track the metrics that really matter, transforming accounting from a simple legal obligation into a real strategic compass for growth.
To build a structure that truly works, you need to strike a balance between three fundamental principles. These pillars ensure that your chart of accounts is not only compliant, but also an agile and powerful management tool.
Designing the ideal chart of accounts means finding the right balance between detail, flexibility, and compliance. Each of these elements plays a crucial role in its long-term usefulness.
Customization is not a luxury, it is a strategic necessity. A chart of accounts that reflects your business model is the first step in transforming accounting data into smart decisions, because it allows you to measure what really matters.
This approach helps you build a structure that actively supports business management. Optimizing this information architecture is a fundamental aspect, as discussed in depth in our article on business process management.
Let's see how these principles translate into practice for different types of SMEs. The goal is always the same: to track costs and revenues in order to obtain clear answers to strategic questions typical of each sector.
1. For an e-commerce company:
The challenge here is to understand profitability by channel and by product.
2. For a construction company:
In this case, the focus shifts to controlling the costs of each individual construction site.
3. For a service agency (e.g., marketing):
Here, profitability analysis by customer or project is everything.
This level of detail, although it requires more careful initial setup, pays off enormously over time. Transform your chart of accounts from a passive archive of numbers into a dynamic dashboard, always ready to guide your next strategic moves.
A well-designed chart of accounts is much more than an accounting requirement. It is a gold mine of structured data, ready to be explored. The problem? Turning those rows of raw numbers into strategic decisions is a task that often translates into hours spent on spreadsheets.
This is where modern technology comes into play. AI-powered data analytics platforms, such as Electe, connect directly to your accounting system and unlock a level of analysis that, until recently, was a luxury available only to a select few.
The real leap forward lies in automating the entire process: from accounting records to the generation of ready-to-use management reports. Artificial intelligence not only speeds up this process, but revolutionizes it, eliminating time-consuming manual extractions and reconciliations that open the door to errors.
Instead of wasting days manipulating data, you can finally focus on what really matters: interpreting the insights that the platform automatically brings to light. AI doesn't just show you the numbers; it helps you understand them.
True power lies not in the data itself, but in the speed and accuracy with which you turn it into action. AI is the bridge that connects your chart of accounts to the decisions that grow your business.
This approach transforms accounting from a reactive, backward-looking process into a proactive driver of strategy, allowing you to anticipate trends rather than react to them.
One of the most powerful advantages of this integration is the AI's ability to dynamically map accounting accounts to different dimensions of analysis. In practice, you can examine business performance from different angles without having to build a report from scratch every time.
Here are some concrete examples of what you can achieve:
This dashboard, for example, shows how raw chart of accounts data becomes interactive and immediate visualizations.
With one click, you can switch from an overview of revenues to a detailed analysis by product category, monitoring trends in near real time.
Even the most meticulous manual analysis has a limitation: the human brain. It is almost impossible for a person to identify complex correlations or significant micro-variations by sifting through thousands of transactions. Machine learning algorithms, on the other hand, were created precisely for this purpose.
By integrating your chart of accounts with an AI platform, you can:
In short, artificial intelligence becomes your tireless financial analyst, monitoring your accounts 24/7 to give you the right information at the right time. This approach is a pillar of modern business intelligence, a topic we explored in depth in our article on Business Intelligence software.
Today, the integration of a solid chart of accounts and AI-powered analysis is no longer a luxury for multinationals, but an accessible and decisive resource for the success of every SME.
Even the most brilliant chart of accounts can turn into a maze of unreadable data if daily management is neglected. Having a solid structure is only half the job; the real value comes from keeping it clean, consistent, and functional over time.
Unfortunately, many SMEs fall into common traps that end up undermining the reliability of their financial analyses. These are mistakes that, while seemingly minor, can have serious consequences, leading to strategic decisions based on distorted information.
Identifying and preventing these pitfalls is the first step in ensuring that the chart of accounts remains what it should be: a reliable strategic tool.
Finding the right level of granularity is an art. On the one hand, there is the risk of creating an overly detailed structure, with hundreds of sub-accounts that no one will ever use. This not only makes data entry more cumbersome, but also renders the final reports unreadable.
On the other hand, a chart of accounts that is too generic is equally harmful. Grouping very different costs under a single heading, such as "Marketing expenses," prevents you from understanding which campaigns are really working. You completely lose the ability to analyze profitability in a targeted manner.
Consistency is the backbone of a good chart of accounts. A classic mistake? Recording the same expense in different accounts. For example, an invoice for software consulting could end up once in "Service costs" and another in "Software and licenses."
This lack of standardization renders the data unusable for any type of comparison or trend analysis. The solution is a clear and shared accounting manual that sets out the rules for classifying each individual transaction in black and white.
A chart of accounts is like a common language: if everyone uses words with different meanings, communication breaks down. Consistency ensures that everyone speaks the same "financial language."
This is a non-negotiable aspect of maintaining data integrity and strategic usefulness.
Your business is not static, and neither should your chart of accounts be. One of the most serious mistakes is to design the perfect structure and then "forget" about it, never adapting it to the evolution of the company.
What happens when you launch a new product line or open a branch? If the chart of accounts is not updated to reflect these changes, the new activities will not be tracked correctly, becoming invisible to analysis.
There are some warning signs that indicate the need for a review:
A periodic review, at least once a year, ensures that your chart of accounts remains an accurate reflection of your business, always ready to provide you with the right data for important decisions.
To transform your chart of accounts from an obligation into a strategic tool, remember these key points:
Even after reading the complete guide, it's normal to still have some questions. Here we have compiled some of the most common questions to give you complete peace of mind when managing your accounting.
A comprehensive review once a year is an excellent habit. But it is not enough. The chart of accounts must be updated immediately whenever something strategic happens in the company, such as:
Waiting for the annual review in these cases means flying blind for months. A timely update, on the other hand, ensures that the plan always accurately reflects your operational reality.
The basic principles are the same for everyone. The purpose of the chart of accounts remains unchanged: to classify costs and revenues in order to understand how the business is performing.
The real difference lies in the level of formality imposed by law.
A limited liability company (Srl) must comply with more stringent financial reporting requirements, following the guidelines set out in the Civil Code. This imposes a more rigid structure, designed to ensure transparency.
A sole proprietorship has more room for maneuver and can adopt a more agile structure. But be careful: "more agile" does not mean "less organized." Even in this case, having a well-designed chart of accounts is a necessity for making decisions based on numbers.
A standard template is an excellent starting point, but never an end point. Using it as is, without customizing it, is one of the most common mistakes and almost completely negates its usefulness.
Think of the model as the foundation of a house: it's essential, but it's not the house itself. True functionality comes when you build the walls and rooms (your accounts and sub-accounts) based on how you want to live in it (your business model).
Use it to understand the logic and overall structure. Then, however, take the time to tailor it to your company. Only then will you transform a simple list of items into a powerful command dashboard.
Your chart of accounts is the first step in transforming data into strategic decisions. The next step is to analyze it with the right technology. Discover how Electe, our AI-powered data analytics platform, can help you illuminate the future of your business and make better decisions in less time.

.svg)
.svg)
.svg)


.png)