Historical oil prices aren’t just numbers on a chart. They tell the story of global crises, technological innovations, and geopolitical shifts that ultimately have a direct impact on your company’s costs. Understanding what happened yesterday is the only way to anticipate what will happen tomorrow.
Analyzing fluctuations in crude oil prices isn’t just an academic exercise—it’s a critical strategic move for any small or medium-sized business looking to turn data into a competitive advantage. That’s exactly why this guide was created: to help you translate these numbers into smarter business decisions.

Events that seem far removed—such as an embargo in the Middle East in the 1970s or the U.S. shale oil revolution—have a direct and measurable impact on your business. These changes ripple through every aspect of your operations: from operating costs to supply chain management, right down to protecting profit margins.
Understanding the history of energy prices is not just a matter of general knowledge, but a practical tool for developing business strategies that can weather crises and look to the future.
For an SME, this means being able to forecast essential costs with greater clarity. Consider the impact on fuel for logistics, energy for production, or petroleum-based raw materials. Ignoring these dynamics is like flying blind in a market that changes every day.
In this guide, we won’t just tell you the story behind historical oil prices. We’ll give you the tools you need to take action. The goal is to turn this knowledge into concrete action, using data to:
By the end of this article, you’ll have a clear understanding of how crude oil price history can be a valuable resource. With an AI-powered analytics platform like Electe—the AI-powered data analytics platform for SMEs—you can automate the analysis of this complex data, turning market volatility into an opportunity for growth.
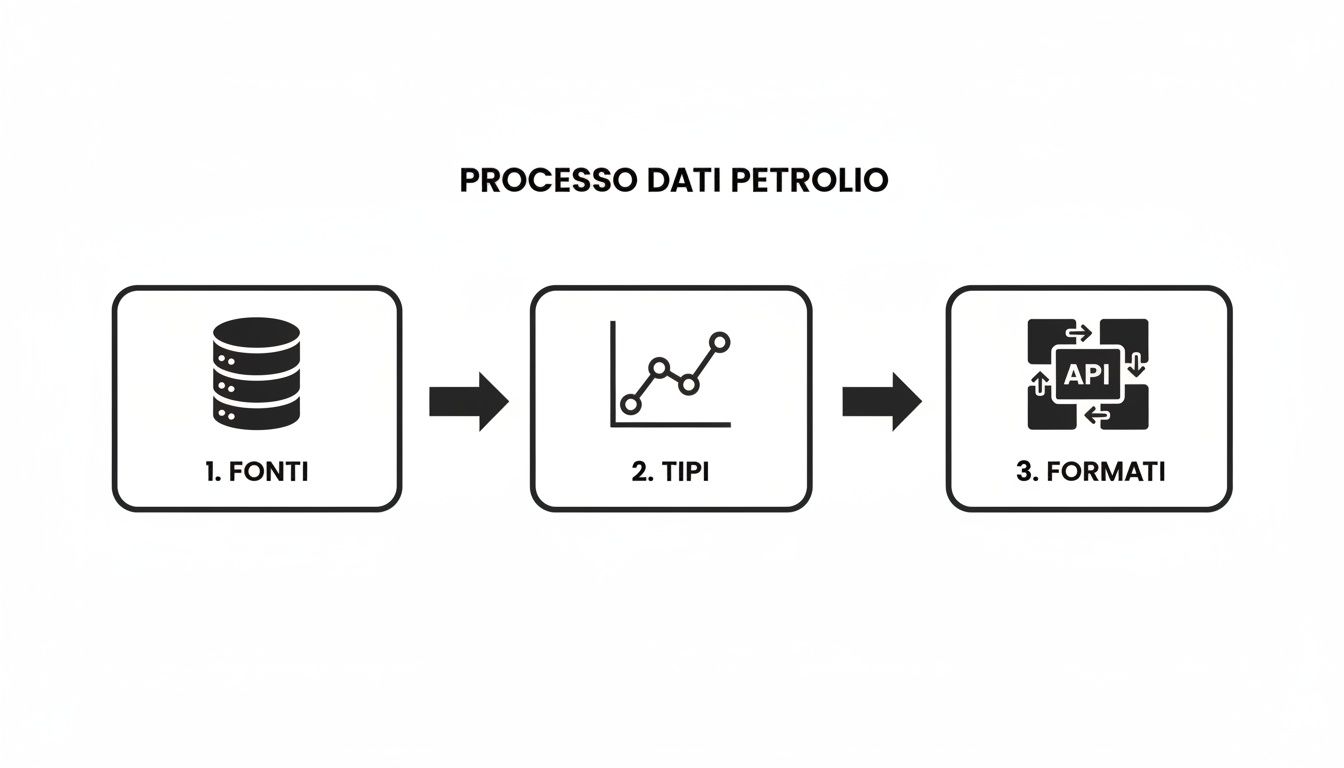
To conduct any serious analysis, there is one golden rule: start with reliable data. In the oil industry, this means first and foremost understanding the global benchmarks that drive the markets and determine historical oil prices.
Choosing the right benchmark isn't just a technical detail—it's a strategic decision. It depends on where your company operates, your suppliers, and your customers.
In the global oil market, there are two key players: Brent Crude and West Texas Intermediate (WTI). Their prices often move in tandem, like two dancers following the same music, but the differences between them are crucial for an accurate analysis.
For an Italian company that purchases raw materials or is exposed to transportation costs in Europe, Brent crude is almost always the most important figure to keep an eye on.
The Brent-WTI spread—that is, the price difference between the two—is not just a number. It is a powerful indicator that reflects the tensions between U.S. supply and demand and those of the rest of the world.
To help you better understand the differences, here is a quick comparison chart.
Comparison of the Brent and WTI Oil Benchmarks
A summary table highlighting the key differences between the two main oil benchmarks, to help you choose the one most relevant to your analysis.
Brent Crude is produced in the North Sea and serves as the benchmark for global markets, exerting particular influence on Europe, Africa, and Asia. It is transported by sea via oil tankers, and its price is primarily sensitive to global geopolitical tensions. For Italy, it is of great importance.
West Texas Intermediate (WTI), on the other hand, comes from Texas and other U.S. states, and serves as the primary benchmark for the North American market. It is transported by land via pipelines, and its price is particularly influenced by U.S. inventories and production. While its relevance to Italy is indirect, it remains a useful tool for comparative analysis.
Choosing the right benchmark means tuning into the right channel to interpret the insights that truly matter to your business.
Once you’ve decided which benchmark to use, the next step is to find complete and reliable historical data sets. Fortunately, there are institutions and platforms that provide this data, often for free and in an easily accessible format.
The U.S. Energy Information Administration (EIA) is a veritable goldmine of information. Considered one of the most authoritative sources in the world, it offers highly detailed data on production, inventories, and prices for both WTI and Brent—all free of charge.
Here is an example of how the EIA displays daily spot data, taken directly from their portal.
A chart like this lets you see daily fluctuations at a glance, perhaps linking them to specific news stories or events that shook the market that day.
Other essential sources include:
Having the right source is only half the battle. The other half is getting the data in a format you can actually use. Historical oil prices come mainly in two forms.
CSV (Comma-Separated Values) files are the perfect starting point. They are simple text files that are compatible with any spreadsheet program, such as Excel or Google Sheets. They’re ideal for exploratory analysis, a one-time report, or if you’re just getting started with the data.
APIs (Application Programming Interfaces), on the other hand, are the solution for those who want to take things seriously. An API allows your business software to directly "call" the data source and automatically receive up-to-date information. It’s the way to go if you want to feed forecasting models, business intelligence dashboards, or real-time alert systems without lifting a finger.
Platforms such as Electe were created precisely to eliminate this complexity. Instead of wasting your time downloading CSV files or writing code to query APIs, the platform connects directly to authoritative sources, retrieves the data, and delivers it to you already cleaned, updated, and ready for your analysis. A continuous and reliable data stream, just a click away.
Having access to historical oil price data is just the first step. Raw data, taken directly from the sources, is like an uncut diamond: it holds immense value, but it requires preparation to make it shine. Skipping this step is the most common—and costly—mistake you can make.
An analysis based on "raw" or unnormalized data will inevitably lead to incorrect conclusions, unreliable forecasts, and, ultimately, business decisions that can erode your margins. Fortunately, there are specific techniques for transforming those raw numbers into a solid, consistent resource.
One of the first challenges you face when analyzing historical oil prices over the long term is inflation. A dollar today does not have the same purchasing power as a dollar in 1980. Comparing the $30-per-barrel price back then with today’s $30 would be like comparing apples and oranges: it simply doesn’t make sense.
To make data comparable over time, it is essential to convert nominal prices into real prices. This process, known as indexation, is based on a consumer price index, such as the U.S. Consumer Price Index (CPI).
In theory, the formula is simple: divide the nominal price by the CPI value for that period and multiply it by the reference CPI value (usually the current year). By doing so, you can see the real cost of oil in "today's dollars."
This step is crucial for understanding the true value of crude oil across different time periods, but applying it manually to decades of data can be a complex undertaking.
Below is an overview of the journey that oil data takes, from raw sources to formats ready for analysis.
This workflow shows that data collection is just the beginning. The real magic happens during the cleaning and normalization phase—the stage that transforms raw data into reliable insights.
Another technical challenge—one that is often underestimated—involves the management of futures contracts. Most price data does not refer to an immediate (spot) transaction, but to contracts that expire at a future date.
Every month, when a contract is about to expire, traders "roll over" to the next month's contract. This process, known as a rollover, can create artificial price jumps on the chart. These jumps do not reflect a real change in the market, but merely a difference in value between the two contracts.
If left unchecked, rollovers can throw off your analytical models, causing them to interpret a simple technicality as a sudden spike or drop in supply or demand.
To solve this problem, analysts use a technique called back-adjustment. In practice, this involves constructing a continuous time series by "stitching" the various contracts together and adjusting past prices to eliminate gaps. This results in a smooth and consistent price curve, ideal for analysis and forecasting. If you want to learn more about the basics of visualization, our guide on how to create a chart in Excel can provide some practical tips.
These cleaning processes—from adjusting for inflation to managing rollovers—are essential, but they require time, statistical expertise, and the right tools. For an SME, dedicating internal resources to these activities can be an almost insurmountable obstacle.
This is where AI-powered data analytics platforms like Electe come into play. Our solution is designed to fully automate data preparation.
This way, you can focus on what really matters: interpreting insights and making strategic decisions, while letting technology handle the more complex and repetitive tasks. The result? Faster, more accurate analysis, free from the risk of human error.
Once you have a clean, consistent set of historical oil prices in hand, the most fascinating part of the work begins: deciphering the story those numbers tell. Those charts aren’t just lines on a screen; they’re a record of events that have shaped the global economy. Learning to read those peaks and troughs is essential for building business strategies that not only survive volatility but also exploit it to their advantage.
Historical analysis isn't about predicting the future with a crystal ball, but about recognizing market patterns and reactions. Understanding how production and transportation costs have responded in the past during an energy crisis is an invaluable lesson for preparing for the next one.
The postwar years were a long period of almost surreal stability. Just consider that in February 1948, a barrel of WTI crude oil cost just $2.50. This calm was suddenly shattered in 1973, when OPEC imposed an embargo on the nations that had supported Israel during the Yom Kippur War.
The impact was immediate and devastating: prices skyrocketed from $3 to over $11.50 within a year. For a country like Italy, which at the time imported 98% of its energy needs, the consequences were dramatic, with fuel prices nearly tripling. If you’d like to learn more about the impact on the Italian economy, you’ll find an interesting analysis on Money.it.
This event teaches you a key lesson: geopolitical shocks can disrupt prices much more quickly and violently than normal supply-and-demand dynamics. On the chart, this translates into a nearly vertical spike—an unmistakable sign of a crisis.
The history of oil, however, is not all about price hikes. Following the crisis of the 1970s, the high prices spurred the search for new oil fields outside OPEC (such as in the North Sea) and prompted consumer countries to become more energy-efficient.
The result was an oversupply that, by the mid-1980s, had become unsustainable. To defend its market share, Saudi Arabia decided to abandon its policy of production cuts and opened the floodgates. The result was the “counter-shock” of 1986: prices plummeted from around $30 to $10 per barrel in just a few months. For Italian SMEs, it was a breath of fresh air, with a reduction in operating costs that reached as much as 40% in sectors such as transportation and manufacturing .
This episode demonstrates how a long-term trend (the rise in non-OPEC supply) can culminate in a sudden collapse, revealing that energy markets tend to correct excesses abruptly.
The new millennium brought with it a level of complexity never seen before. The rapid economic growth of China and other emerging economies created a seemingly insatiable demand for oil, driving the price of Brent to a record high of nearly $150 per barrel in July 2008.
A few months later, the collapse of Lehman Brothers triggered the most severe global financial crisis since 1929. Demand for oil plummeted, and with it, prices, which fell below $40 in less than six months.
This event has shown just how closely the oil market is now intertwined with the global financial system. A shock that is no longer directly linked to crude oil production, but rather to the financial system, can trigger fluctuations of a magnitude never seen before.
For an SME, the lesson is clear: simply monitoring oil fundamentals is no longer enough. It is necessary to take a broader view that also includes macroeconomic and financial indicators.
The real skill lies in distinguishing between a sudden shock and a long-term trend.
Understanding this difference helps you avoid reacting impulsively to every fluctuation and enables you to develop more robust and resilient procurement and pricing strategies. With tools like Electe, you can visualize these historical events and correlate them with your company’s data to understand how your business has responded in the past and better prepare for the future.
Analyzing historical oil prices isn’t just an academic exercise—it’s a practical tool you can use right away to give your business a competitive edge. Understanding how past price fluctuations have affected costs allows you to build models to anticipate future trends and make decisions based on data, not gut feelings.
In this way, volatility ceases to be a threat and becomes a calculated opportunity.

For an SME, this means one thing: shifting from reactive to proactive management. Instead of passively accepting rising costs, you can prepare in advance, protect your margins, and maintain your competitiveness in the market. Let’s see how to apply these concepts in the real world.
For any company that manages a fleet of vehicles or relies on third-party shipping, fuel costs are one of the most critical—and, above all, most variable—expense items. Analyzing historical fuel data allows you to go far beyond simply tracking the price at the pump.
By combining these historical data sets with your operational data, you can build predictive models that forecast fuel cost trends.
This allows you to optimize shipping rates weeks in advance, plan the most energy-efficient routes, and negotiate more favorable supply contracts based on reliable forecasts.
A platform like Electe automate this process by correlating historical Brent or WTI data with your logistics costs to provide you with clear, actionable insights. To learn more about how data can guide your strategy, read our article on the importance of big data analytics for businesses.
If your company operates in the manufacturing sector, energy prices directly affect production costs. Electricity to power machinery, petroleum-based raw materials (such as plastics), and the cost of transporting materials are all closely tied to fluctuations in crude oil prices.
By analyzing historical oil prices and comparing them to your past production costs, you can create a significantly more accurate budgeting model.
This data-driven approach transforms the budget from a mere accounting exercise into a strategic tool for managing operational risks.
For an e-commerce business, shipping costs are a key factor in both profit margins and customer satisfaction. Fluctuations in fuel prices directly affect the rates charged by carriers, eroding profits if not carefully managed.
The impact can be enormous. In 2021, for example, the price of WTI crude oil in Italy rose by 25% year-over-year. This led to a 30% increase in fuel prices, affecting e-commerce SMEs with shipping costs up 18% from the previous year. By using AI platforms, companies can identify these correlations and predict their impacts with great precision, reducing operating costs by up to 15%. To learn more about these dynamics, you can consult a detailed analysis of price trends in 2021.
By analyzing historical data, an e-commerce business can:
With a platform like Electe, you can integrate historical oil price data directly with your sales and logistics data. The platform automatically generates visual reports and insights that reveal hidden correlations, allowing you to make quick, informed decisions without having to manually analyze complex spreadsheets.
Below is a table summarizing how various industries can apply historical oil data analysis to gain measurable competitive advantages.
Use Cases for Oil Price Analysis by Industry
In the logistics and transportation sector, the practical application involves creating predictive models for fuel costs, resulting in measurable benefits such as optimized rates and a reduction in operating costs of up to 15%.
In the manufacturing sector, forecasting energy costs enables more accurate budgeting, which directly impacts profit margin management and waste reduction.
In e-commerce, predictive analytics enables businesses to dynamically adjust shipping costs and offer thresholds, protecting margins and boosting conversion rates through more competitive offers.
In agriculture, planning ahead for fuel costs related to machinery and transportation ensures greater predictability of seasonal costs and better optimization of harvests.
In the construction industry, accurately estimating the costs of transporting materials and operating vehicles makes it possible to prepare more precise estimates and maintain tighter control over construction site costs.
As you can see, analyzing historical data isn't just for the big players in the energy sector. It's a powerful and accessible tool for any company that wants to navigate the complexities of the modern market with intelligence.
Historical oil price data isn't just a record of the past. When analyzed properly, it becomes a strategic resource that can give you a decisive edge over the competition. In this guide, we've looked at how to find reliable sources, how to prepare the data for analysis, and, most importantly, how to interpret it to stay one step ahead of risks and opportunities.
For an SME, mastering these dynamics is key to navigating with greater confidence in a global market that is changing at a breathtaking pace. The ability to link energy price fluctuations to one’s operating costs makes it possible to develop more robust strategies and protect profit margins.
The real challenge today isn't finding data. It's turning it into clear, actionable insights that can guide business decisions. And that's where artificial intelligence becomes a powerful ally.
With AI-powered data analytics platforms like Electe, you don’t need to be a data scientist to make sense of complex information. You can automate the entire analysis process—from data cleaning to building predictive models—and get answers in just a few minutes.
This means making decisions based on solid forecasts and optimizing every aspect, from logistics to pricing strategies. If you’re interested in learning more about how data analysis can transform a business, find out more about business intelligence software in our dedicated article.
In short, historical analysis becomes the driving force behind smart, sustainable growth. Illuminate your company’s future with artificial intelligence and discover how our platform can help you turn the complexity of the energy market into a clear path to success. Data-driven decision-making is no longer a luxury reserved for the few, but a necessity within everyone’s reach.
To help you focus on the key concepts, we’ve compiled answers to some of the most common questions that arise when analyzing historical oil prices. Think of these as practical insights to help you refine your strategies right away.
Imagine you're at the market. The spot price is what you pay to get oil right now, for immediate delivery. It accurately reflects supply and demand at this very moment.
A futures price, on the other hand, is an agreement you make today for a delivery that will take place in the future. This price doesn’t just look at today; it tries to “predict” tomorrow, factoring in all expectations regarding production, consumption, and, of course, the inevitable geopolitical tensions. For long-term analysis, time series based on futures contracts (with the necessary adjustments) are almost always the best choice, because they offer a more comprehensive and continuous view over time.
Oil consumption follows its own rhythm, much like the seasons. Think about summer: more people travel by car for vacation, and demand for gasoline skyrockets (the famous American "driving season "). In contrast, more heating oil is needed in winter.
To avoid being misled by these predictable peaks and troughs, you can use time series decomposition techniques. Essentially, you "break down" the historical data series into three components: the underlying trend, the seasonal cycle, and the background noise. Isolating the seasonal component allows you to make much cleaner and more accurate forecasts.
The right frequency depends on your industry and your goals. If you work in logistics, a weekly update may be more than enough to adjust shipping rates without driving yourself crazy.
If, on the other hand, you’re involved in financial trading or real-time risk management, the situation is completely different. In those cases, models may need to be updated daily, or even multiple times a day (intraday). A good place to start? Begin with a weekly frequency, measure the accuracy of the forecasts, and then shorten the update interval if necessary.
Ready to turn historical data into reliable forecasts for your business? With ElecteWith Electe, you can automate your analysis and gain clear, actionable insights in just a few clicks. Start your free trial now and illuminate the future of your business.

.svg)
.svg)
.svg)