Every day, your company faces a mountain of data. From monthly expenses to sales pipelines, keeping track of everything can seem like a daunting task, especially when you start with a blank spreadsheet. Many people rely on Excel, but end up wasting precious hours trying to create functional tables from scratch, often with ineffective results. What if you could skip this step and have ready-to-use templates designed to solve your specific business problems?
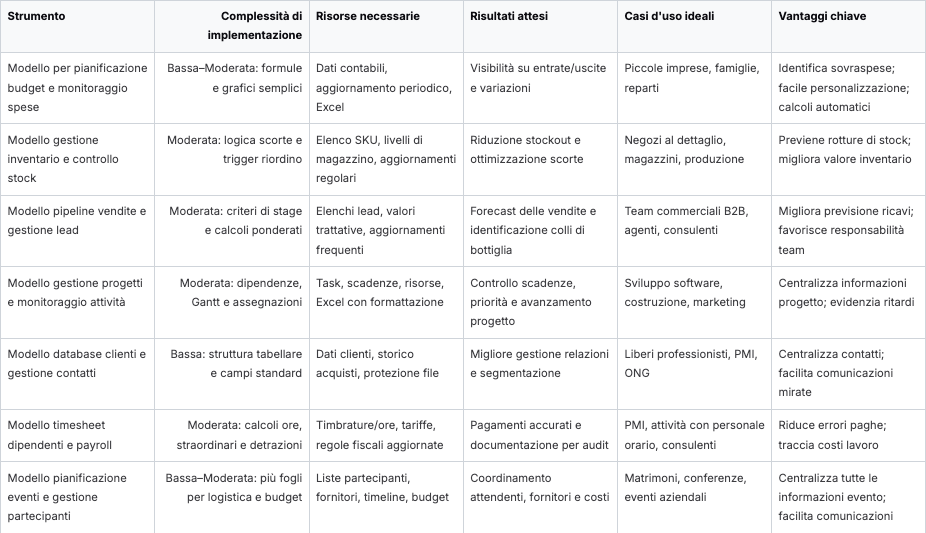
This article is the answer you're looking for. We'll guide you through a collection of practical examples of Excel tables, complete with templates ready to be customized. We'll cover the crucial areas of every business: from budget and inventory management to sales tracking and project planning. A great example of how Excel tables can be enhanced is the skills matrix, a visual tool for mapping and developing talent within a company.
For each example Excel table provided, we will not just show you the structure. We will analyze in detail the strategies for adapting each model to your specific data, offering tactical insights to maximize its usefulness. Finally, we will show you how these powerful tools are only the first step. You will understand when it is time to evolve, integrating your data with advanced analytics platforms such as Electe automate insights, obtain accurate forecasts, and transform simple numbers into strategic decisions that accelerate your growth. Get ready to say goodbye to blank sheets and unlock the true potential of your data.
A budget and expense tracking template is one of the most effective tools you can create with Excel. This example Excel spreadsheet serves as a financial control center, allowing SMEs to plan finances, monitor cash flow, and identify savings opportunities. Its structure is based on comparing forecasts (budget) with actual data (actual expenses), giving you a clear picture of your financial health.

Its popularity stems from its simplicity and power. Accounting software companies and financial advisors often provide advanced versions of these templates, but the basic version remains one of the most common downloads from the Microsoft Office template library.
An effective budget template is not just a record of income and expenses; it is a strategic tool for your decision-making process.
Tactical Insight: Variance analysis isn't just about identifying problems. A positive variance (lower-than-expected spending) can free up resources to be reallocated to strategic areas, such as new product development or marketing campaigns.
To maximize the effectiveness of this sample Excel table, consider these tips:
This data becomes a valuable basis for more complex analyses. By integrating these spreadsheets with an analytics platform, you can unlock automated reporting. If you want to find out how to turn your spending data into strategic forecasts, explore the potential offered by modern business intelligence software. This allows you to move from reactive control to proactive financial management.
An inventory management template is a crucial Excel spreadsheet for any business that handles physical products, from retail stores to e-commerce. This tool serves as a centralized ledger for tracking stock levels, monitoring product movements, and establishing reorder points to avoid stockouts or excess inventory. Its structure allows you to have precise control over one of your company's most important assets.
Its popularity stems from its ability to transform a complex process into a manageable, data-driven activity. E-commerce platforms such as Shopify and supply chain professionals often recommend using these models as a first step toward optimizing the supply chain.
A well-structured inventory spreadsheet goes beyond simply counting products; it is a strategic tool for optimizing your operations.
Tactical Insight: Identifying slow-moving products is not just about freeing up space. This data can guide decisions on targeted promotions or clearance discounts. In this way, operational data becomes a marketing lever.
To make this Excel example table a dynamic and reliable tool, follow these tips:
These inventory models are just the starting point. For deeper analysis, such as demand forecasting, you need to take it one step further. Modern AI-powered analytics platforms can connect to your Excel data to provide accurate forecasts. If you want to transform your reactive control into predictive inventory management, discover how advanced tools can analyze your data to optimize your stock.
A sales pipeline is a visual representation of your sales process, from initial contact with a lead to closing the deal. This example Excel spreadsheet serves as the central nervous system for any sales team, allowing you to track opportunities through the various stages. It is an essential tool for monitoring performance, forecasting future revenue, and identifying bottlenecks.
Its effectiveness lies in its ability to transform a chaotic process into a structured and measurable workflow. While CRM software offers sophisticated solutions, a well-designed Excel template remains an incredibly powerful tool, especially for SMEs that need a flexible solution.
A sales pipeline template is much more than just a list of contacts; it is a diagnostic and forecasting tool for your sales strategy.
Tactical Insight: Analyzing the conversion rate between one phase and another is crucial. If the transition from "Proposal" to "Negotiation" has a low rate, the problem may lie in the quality of the proposals. This data allows you to take targeted action.
To turn this sample Excel table into a sales engine, follow these tips:
This model not only organizes the present, but also lays the foundation for a data-driven future. By integrating historical sales data with more advanced tools, you can move from reactive to predictive management. If you want to transform your pipeline into a predictive tool, find out how predictive analytics platforms for SMEs can automate this process, providing you with accurate sales forecasts.
A project management template is an essential tool for organizing, monitoring, and completing complex projects on time and within budget. This example Excel spreadsheet serves as an operational dashboard, giving you a clear overview of individual tasks, deadlines, resources, and progress. Its structure allows you to break down a project into manageable tasks and assign them to your team.

The popularity of this model stems from its flexibility in replacing more complex project management software, especially for SMEs. It is widely used by those who adopt methodologies such as Agile and Scrum.
A project management spreadsheet is not just a to-do list; it is a strategic tool for governance and execution.
Tactical Insight: The "Status" column (e.g., To Do, In Progress, Completed) is not just an indicator, but a trigger for action. By filtering for "Overdue," your team can focus meetings only on real issues, making the process more efficient.
To turn this sample Excel table into a powerful command center, consider these tips:
Effective project management is a cornerstone of success. To further optimize these workflows, it is essential to integrate project data with a broader view of business processes. To understand how to align operational activities with strategy, learn more about business process management. This holistic approach helps ensure that every project contributes to your goals.
A customer database is a vital strategic resource, but not all SMEs can afford a comprehensive CRM system. An example Excel table for contact management serves as a powerful and customizable alternative. This template centralizes customer information, from personal details to purchase history, transforming a simple spreadsheet into a business intelligence tool.
Its effectiveness lies in its ability to organize complex data into an accessible format, giving your teams a 360-degree view of each contact. It is a common starting point for startups and independent professionals who appreciate its flexibility and lack of upfront costs.
A well-structured customer database is much more than a digital address book; it is an engine for personalization and loyalty.
Tactical Insight: Adding a "Next Follow-up Date" column and using conditional formatting to highlight upcoming deadlines transforms a passive database into a proactive reminder system. This simple trick ensures that no opportunity is forgotten.
To transform this sample Excel table into a real CRM tool, consider the following steps:
SEARCH.VERT or TABLE OF CONTENTS and COMPARE They are perfect for linking this sheet to others, such as a sales log, automatically extracting customer details.As your customer base grows, manually managing this data can become complex. To unlock deeper insights, it is useful to integrate this data with external platforms. The goal is to move from data collection to a true information-driven strategy.
An Excel template for timesheets and payroll is an essential tool for human resources management, especially for SMEs that need an efficient system for tracking working hours. This sample Excel spreadsheet serves as a centralized record for monitoring working hours, managing overtime, and accurately processing payroll.
Its usefulness lies in its ability to automate complex calculations that would otherwise be time-consuming and prone to errors. Employment consulting firms and HR software providers offer integrated solutions, but a well-structured Excel model remains an agile and cost-effective tool, perfect if you are looking for control and flexibility.
This model goes beyond simply recording hours; it is a strategic tool for optimizing labor costs and ensuring fair pay.
Tactical Insight: Analysis of the collected data can reveal significant patterns. A constant spike in overtime in a department may indicate a shortage of staff or inefficient processes. This data becomes the basis for strategic decisions such as new hires.
To maximize the effectiveness of this sample Excel table, consider these tips:
IF to automatically calculate overtime hours and apply the correct surcharge, eliminating manual calculations.hh:mm) to prevent typing errors.$B$1) for tax rates or hourly rates. This way, you only need to update a single cell to recalculate all paychecks.This meticulous data management creates a valuable historical archive. By linking this data to more advanced platforms, you can perform predictive analytics on labor costs. To discover how to transform payroll data into strategic forecasts, explore the solutions offered by advanced business intelligence software.
An event planning template is a versatile solution that transforms Excel into a command center for any type of event. This sample Excel spreadsheet is designed to coordinate all the variables involved, from the guest list to supplier management, from the budget to logistics. It allows you and your team to keep track of every detail, ensuring that nothing is left to chance.
Its usefulness is recognized by professionals in the sector, who often use it as a flexible and customizable alternative to expensive dedicated software. Its ability to centralize disparate information makes it an indispensable tool.
A well-structured event planning model is an integrated ecosystem that promotes strategic decisions and flawless execution.
Tactical Insight: Use the data you collect to optimize future events. By analyzing the participation rate by invitation channel or the average spend per participant, you can identify the most effective strategies. The data is not only useful for managing the current event, but also for making the next one even more successful.
To turn this sample Excel table into a professional tool, adopt these practices:
These templates are essential for flawless execution, but their true potential is unlocked when the collected data is analyzed. If you want to understand how your event data can reveal trends and optimize ROI, data analytics platforms are the next step. Discover how to transform simple attendee lists into powerful business intelligence tools.
In this article, we explored a collection of templates, analyzing each Excel example as a strategic tool to revolutionize the management of your business data. From budget spreadsheets to inventory and sales management to project planning, each template provides a solid foundation for organizing information in a structured way. We saw how to customize formulas and use conditional formatting to highlight priorities.
These templates are not just static archives. They are dynamic tools that, when used correctly, become the first step toward a data-driven corporate culture. Their true strength lies in their ability to transform messy lists of information into readable dashboards, giving you a clear view of daily operations. Mastering these tools means building a solid foundation for performance monitoring.
However, it is essential to recognize the limitations of Excel as your business grows. Manual entry remains a source of errors, collaboration on large files can become cumbersome, and, most importantly, predictive analytics is nearly impossible to achieve without specialized skills.
The turning point comes when you realize you're spending more time updating and correcting data in your spreadsheets than interpreting it to make decisions. This is a sign that you've outgrown Excel's capabilities and need a more powerful tool.
Data analysis platforms such as Electe designed to overcome these barriers. The natural evolution from a well-structured Excel spreadsheet is automation. Instead of copying and pasting data, an AI-powered platform connects directly to your systems (CRM, management software) and centralizes information in real time. This not only eliminates the risk of errors, but also frees up valuable time that you can devote to strategic analysis.
The real paradigm shift is not just automation, but intelligence. While Excel can show you what happened (last month's sales), artificial intelligence can explain why it happened and predict what will happen next. It can identify hidden patterns invisible to the human eye, such as the correlation between a marketing campaign and the purchasing behavior of a customer segment.
This shift from reactive analysis to proactive and predictive management is the key to gaining a competitive advantage. It is no longer a matter of looking back to understand what worked, but of looking ahead to anticipate market needs and make faster, more informed decisions. Excel models are an excellent starting point for organizing your data, but their potential is only fully realized when they are integrated into an analytical ecosystem capable of transforming numbers into real strategic guidance.
Are you ready to take the next step and transform your data from a simple archive into an engine for growth? Find out how Electe, an AI-powered data analytics platform for SMEs, can automate your reports, generate accurate forecasts, and provide you with the insights you need with just one click. Visit our website and request a free demo to see the platform in action.

.svg)
.svg)
.svg)