Business data analysis is the process that transforms raw numbers and scattered data across your systems into strategic insights. In short, it allows you to make decisions based on facts, not just on intuition. It’s the engine you need to optimize operations, better understand your customers, and anticipate market trends.
In a hyper-competitive market, relying solely on instinct is a luxury that no company—especially an SME—can afford anymore. Many Italian businesses are sitting on a goldmine of data, but they don’t know how to extract it and turn it into practical strategies. The good news is that the solution is more accessible than you might think.
This guide is not a technical manual. It is a strategic roadmap, a step-by-step guide to showing howbusiness data analysis can become a daily practice that drives your growth.
Together, we will look at:
With the right tools, anyone on your team can start making smarter, faster decisions.
Data analysis almost never starts with a spreadsheet. It starts with a clear question. Diving into the numbers without a clear direction is the most common mistake: you risk wasting valuable resources. The key is to start with strategic objectives.
The first step is to translate a general objective into specific questions—questions that data can actually answer.
Let's see some practical examples:

Once the questions have been identified, the next step is to figure out where the answers lie. SMEs often already have a wealth of data, but the problem is that it is fragmented.
The most common sources are:
A retail company, for example, could cross-reference sales data with inventory data to optimize stock levels. A financial services firm would focus on transaction data and customer risk profiles.
Research by the Digital Innovation Observatories at the Politecnico di Milano shows that, although89% of Italian SMEs perform data analysis, eight out of ten do not integrate their various data sources or do so manually. You can explore the data in more detail directly on the Observatories’ website. This gap is precisely where Electe, an AI-powered data analytics platform for SMEs, comes into play, automating data integration and analysis.
Raw data is almost always a mess: incomplete, riddled with typos, and full of duplicates. Skipping thedata cleaning phase is like building a house on a foundation of sand. A customer address written in three different ways (“Via Roma 1,” “v. roma, 1,” “Via Roma N.1”) is treated by the system as three distinct customers. This can completely skew any results.
Data Cleaning Checklist:
Modern platforms such as Electe automate most of these tasks, reducing the risk of human error.
Once your data is clean and reliable, you can finally start making sense of it. The journeyinto business data analysis unfolds across three levels, each of which answers increasingly deeper questions.
The ultimate goal is not just to look back to understand what happened, but to look ahead to decide what to do.
Imagine you run an e-commerce business.Descriptive analysis shows you a 20% drop in sales in July. You move onto diagnostic analysis, which reveals that the drop coincides with the end of a promotion. At this point,predictive analysis estimates that without new actions, the decline will continue. Armed with this information, you can launch a new targeted promotion, addressing the issue proactively. If you want to learn more, find out how to turn raw data into useful insights in our article.
Today, the adoption of AI for data analysis is on the rise: according tothe Istat survey on businesses and ICT, 16.4% of Italian companies already use it. However, a lack of expertise remains a barrier, holding back 60% of companies. This is where platforms like Electe advanced analytics accessible to everyone.
An insight is only useful if it is communicated effectively. Dashboards serve as the bridge betweenbusiness data analysis and strategic decisions. Their purpose is to allow anyone to see at a glance what is working and what isn’t.

A metric is a quantifiable measure (e.g., website visitors). A KPI (Key Performance Indicator) is a metric linked to a business objective (e.g., conversion rate).
Not all metrics are KPIs. A KPI always tells a story about progress toward a goal. Focus on 3–5 key KPIs to avoid confusion.
If you'd like to learn more, you can read our article on how to choose the right Key Performance Indicators for your company.
An effective dashboard should be simple and focused on the right KPIs. Here is a template that works well for most companies.
The main KPI in the Sales Overview section is Monthly Revenue vs. Target, displayed as a line chart. It is used to monitor revenue trends and progress toward the target.
The Customer Acquisition section focuses on the Customer Acquisition Cost (CAC), which is displayed as a bar chart by channel. The goal is to understand how much is spent to acquire a new customer and which channels are the most efficient.
The Product/Service Performance section highlights the top 5 products by revenue using a horizontal bar chart. It helps identify the products that generate the most value and guide the sales strategy.
The Customer Loyalty section uses the Repeat Purchase Rate as a key metric. Its purpose is to measure customer loyalty and the effectiveness of loyalty strategies.
The Operational Efficiency section tracks the Average Order Fulfillment Time using a line chart. It allows you to monitor the efficiency of internal processes and the level of end-customer satisfaction.
The choice of chart is practical. Platforms such as Electe suggest the most suitable chart type and let you create interactive dashboards with just a few clicks. If you’d like to learn more, we’ve written a guide on the 10 essential chart types for turning data into decisions.
We’ve covered the complete framework for getting started withbusiness data analysis. It’s no longer a luxury reserved for the few, but a necessity for competing and winning.
Here are the key steps:
This image illustrates the process that transforms raw data into decisions that make a difference.
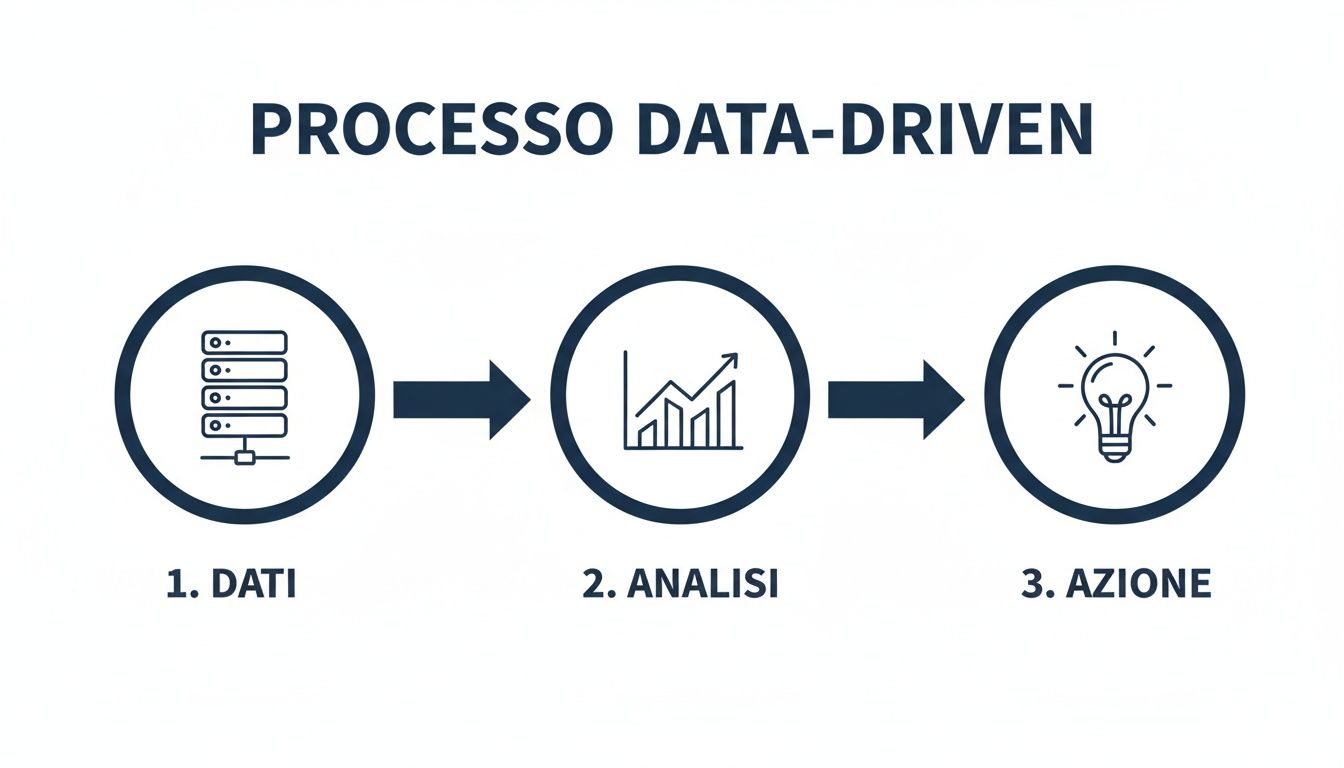
The process begins with data, moves through analysis, and culminates in action. It is this final step—taking action—that is the true goal of every insight.
Every company, regardless of its size or expertise, can and should harness the hidden power of its data. Inertia and the fear of getting started are the real obstacles—not the technology.
Today, with AI-powered platforms such as Electe, the old excuses no longer hold water. These tools were created to break down barriers, making advanced analysis accessible to everyone and delivering tangible results quickly.
Don’t put off the decision that could change the course of your business. Your next step is simply to get started. See for yourself how easy it can be to turn your data into a real competitive advantage.
Start your free trial of Electe now Electe
Let’s address some of the most common questions we hear from small and medium-sized businesses when they first venture into the worldof business data analysis.
It’s simple: start with a single, urgent business goal. The most common mistake is trying to analyze everything at once. The right question to ask yourself is: “What’s the most pressing problem I need to solve, or the biggest opportunity I want to seize right now?” Maybe it’s figuring out why sales of a key product have dropped. Perfect. Start by collecting only the data you need to answer that question.
Practical tip: Choose a small but impactful problem. An early win will generate the enthusiasm needed to tackle bigger challenges and will convince the team of the value of this approach.
Platforms such as Electe are designed specifically for those just getting started. They guide you through connecting data sources and automate the analysis, so you can focus on strategic insights.
Costs are no longer the barrier they once were. The era of expensive servers and lengthy implementation projects is over. Today, the smartest and most cost-effective solution is a cloud-based data analytics platform, or SaaS (Software as a Service). This model, which is the one used by Electe, is based on monthly or annual subscriptions. You start with a minimal investment and add features only as your needs grow, eliminating hidden maintenance and upgrade costs.
Security is, understandably, one of the main concerns. Reputable data analytics platforms prioritize data protection. Always verify that the provider complies with regulations such as the GDPR and uses standard security protocols, such as data encryption. Choose a European platform such as Electe offers added peace of mind: we were founded to be fully compliant with our continent’s strict privacy regulations, ensuring that your data is handled with the highest security standards.
Ready to turn your data into strategic decisions? With Electe, business data analysis becomes simple, fast, and powerful.

.svg)
.svg)
.svg)