Balance sheet ratios are not just mathematical ratios, but real diagnostic tools for your company. They take raw data from your balance sheet and income statement and transform it into simple, clear, and, above all, comparable indicators. They are essential for "taking the pulse" of your business, assessing its economic, financial, and asset health, and guiding your strategic choices with real data, not instinct. In a competitive market, understanding and using these indicators is not an option but a necessity for sustainable growth.
This guide will show you the key formulas, but above all, it will teach you how to interpret them to turn numbers into better decisions. You will discover how to measure the profitability, liquidity, and solidity of your SME, identifying strengths and areas for improvement. We will see how AI-powered platforms such as Electe can automate these calculations, making analysis accessible and immediate, even if you are not an accountant. The goal is to give you the tools to build a data-driven corporate culture, where every choice is supported by clear and actionable insights.
Understanding how your business is performing cannot be based solely on gut feelings. You need objective data, numbers that give you a clear picture of performance. This is where financial ratios come in: tools that translate the complexity of accounting documents into practical, immediately usable insights.
Think of metrics as blood tests for your business. A single value, taken on its own, tells you very little. But when analyzed alongside others, it offers a surprisingly comprehensive diagnosis. Similarly, a single metric has limited meaning. It is their combined analysis that reveals the true strengths and, more importantly, the weaknesses of your management.
In short, index analysis helps you answer fundamental questions:
This guide will not be limited to a cold list of balance sheet formulas. The goal is to go further, showing you how to interpret the results to make smarter decisions, optimize management, and build a solid data-driven corporate culture. Business intelligence platforms such as Electe, the AI-powered data analytics platform for SMEs, automate these calculations, making analysis accessible and immediate even for those who are not professional accountants.
To help us navigate, we can group the main financial statement ratios into four macro-categories, each with a specific objective.
Here is a summary table categorizing the main indices, their purpose, and the indicators that we will analyze in detail.
This breakdown will help us explore every aspect of business performance in a structured way, starting with an overview and then going into detail on each individual indicator.
The following infographic visually summarizes the three key areas we will explore, linking economic, financial, and asset aspects.
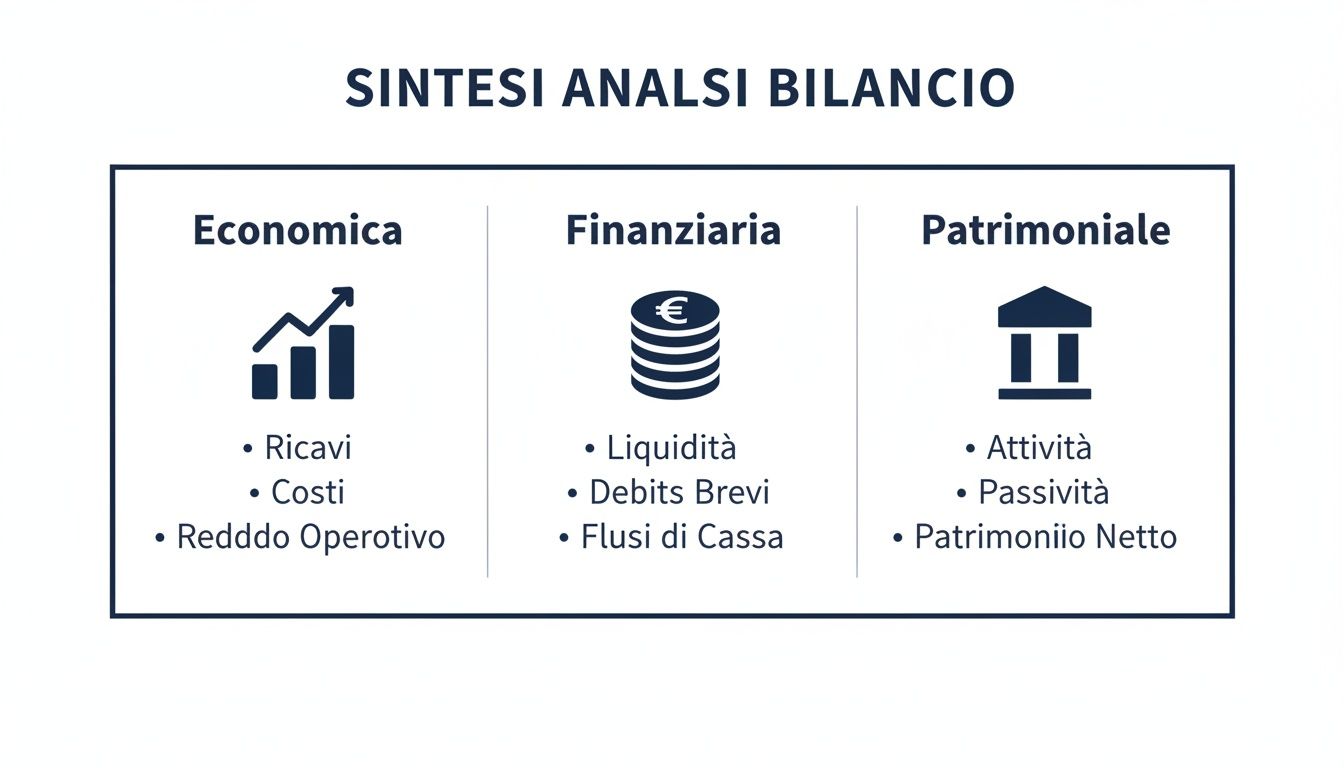
This visual map clearly shows how financial statement analysis is structured around three interconnected pillars: economic analysis (profits), financial analysis (cash flows), and equity analysis (capital structure). Each is essential for obtaining a comprehensive and realistic view of a company's health.
A company's ability to generate profits is at the heart of its very existence. Profitability ratios are like a CT scan: they allow you to measure this ability, transforming the cold numbers of the income statement and balance sheet into clear indicators of performance.
These indices not only tell you whether you are making a profit, but above all how and how efficiently. In practice, they answer crucial questions: are you getting an adequate return on the capital you have invested? Is your operational management efficient? Are your partners' investments really creating value?
Let's take a look at the most important financial ratio formulas for analyzing profitability, with practical examples to help you quickly understand how to calculate them and, above all, what they mean for your business.
ROE is the indicator that interests shareholders and investors the most. It measures the profitability of risk capital, i.e., how much profit your company can generate for every dollar invested by its owners. It answers the question: "Is my investment paying off?"
Formula:ROE = (Net Profit / Shareholders' Equity) * 100
How to interpret it:
A high ROE is almost always good news, because it means that shareholders' money is working well. Ideally, ROE should exceed the return you could get from low-risk alternative investments.
Practical example:
ROI is the key indicator for understanding the efficiency of core operations. In simple terms, it measures how much profit you can generate with the total capital invested, without worrying about how this capital was financed (whether with your own money or with debt).
Formula:ROI = (Operating Income / Invested Capital) * 100
How to interpret it:
A high ROI is an excellent sign. It means that operational management is efficient and capable of generating a good return on the assets that the company uses.
Practical example:
ROA measures the total profitability of a company's assets. It explains how efficiently your company is able to transform everything it owns (total assets) into profits.
Formula:ROA = (Net Profit / Total Assets) * 100
How to interpret it:
ROA gives you an overview of resource efficiency, without distinguishing between operational, financial, or other management. It is very useful for comparing companies in the same sector with different financial structures.
Calculating and keeping an eye on these balance sheet ratios is not purely an academic exercise. It is the first step towards informed management, which transforms data into strategic decisions for profitable and sustainable growth.
Liquidity is the lifeblood of a business. You can have the best products in the world and record profitability, but if you can't meet your short-term financial commitments, any growth strategy is likely to fall apart. That's why monitoring liquidity is not an option, but a vital necessity.
Liquidity ratios measure precisely this: your company's ability to meet its current liabilities (such as debts to suppliers or loan installments) using the assets it has available in the short term. These balance sheet ratios are a fundamental warning sign, a tool that allows you to prevent cash crises and ensure operational stability.
Now let's take a closer look at the two most important indicators for assessing your short-term creditworthiness.

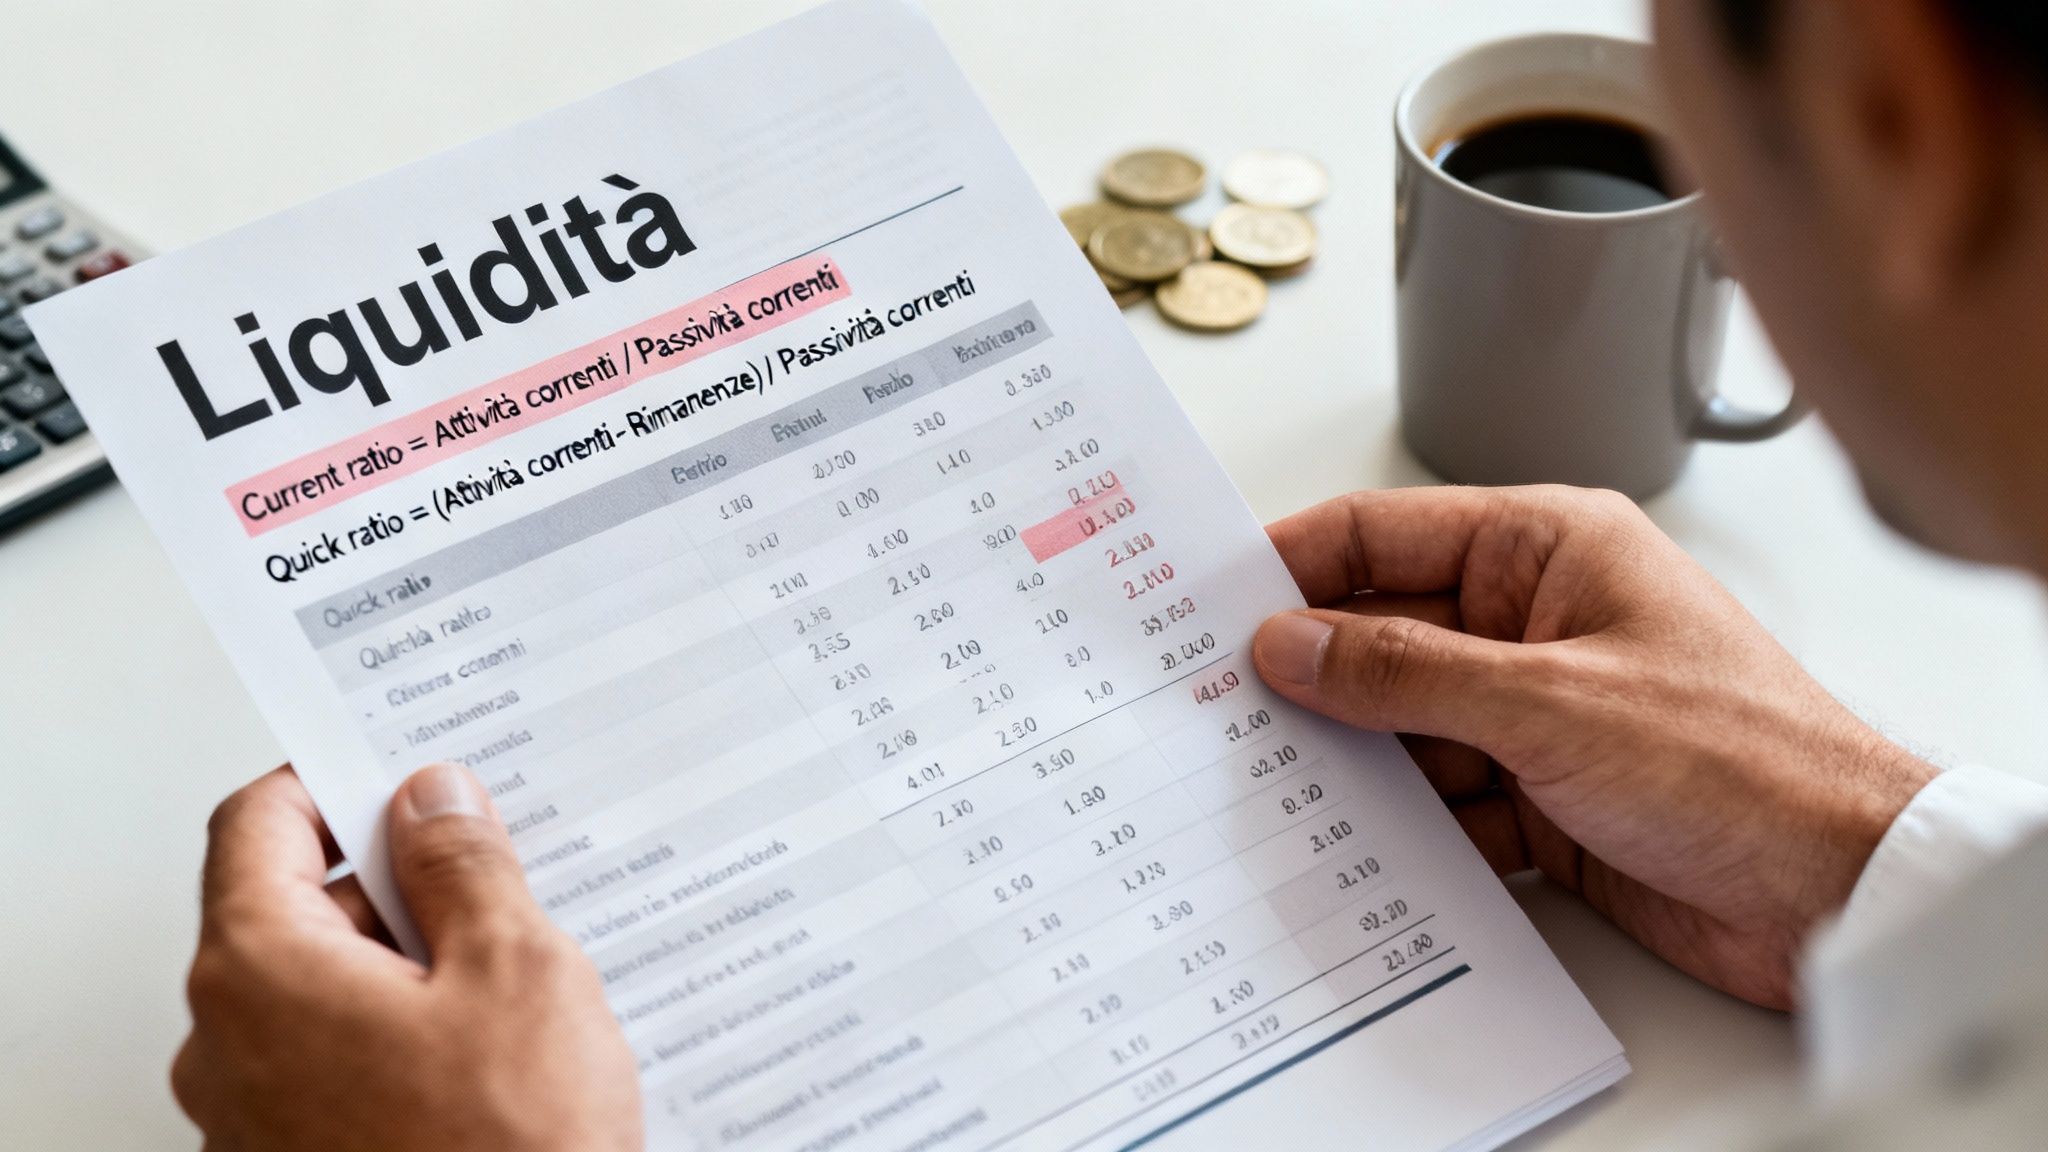
The current ratio is the most immediate and widely used indicator for gauging liquidity. It simply compares all assets that can be converted into cash within a year (current assets) with all debts to be paid within the same period (current liabilities).
Formula:Current Ratio = Current Assets / Current Liabilities
How to interpret it:
The result tells you how many times your short-term activities can cover your short-term debts.
Practical example:
The Quick Ratio, also known as the "Acid Test," is a stricter and more conservative version of the Current Ratio. It gives you an even more realistic view of immediate payment capacity because it excludes inventory from the calculation. Why? Because inventory is not necessarily easy and quick to convert into cash.
Formula:Quick Ratio = (Current Assets - Inventories) / Current Liabilities
How to interpret it:
This index measures the ability to cover short-term debt using only the most liquid assets: cash and receivables.
Practical example:
Constantly analyzing these balance sheet ratios allows you to stay ahead of the game, ensuring the financial stability that is essential for growing your business in a healthy and sustainable way.
In addition to profitability and liquidity, there is a third pillar on which the survival (and growth) of a company rests: its financial strength. This analysis takes a long-term view and focuses on the sustainability of your financial structure. Put simply, it answers a crucial question: is your business too dependent on external financing?
Solvency ratios, or leverage ratios, measure precisely this: the balance between equity (the money invested by shareholders) and debt (liabilities). Mastering these balance sheet ratios helps you understand the real level of financial risk and build a capital structure that can withstand market turmoil.
The most direct and powerful indicator for measuring how much your company "lives" on debt is the Debt to Equity Ratio. Its task is simple: to compare the company's total debt with its net assets.
Formula:Debt to Equity Ratio = Total Liabilities / Net Equity
How to interpret it:
The result tells you how many euros of debt you have accumulated for each euro of capital paid in by shareholders. A little debt, if used wisely, can help the company grow faster ("leverage effect"), but when you overdo it, the risk skyrockets.
Practical example:
In this scenario, the company finds itself right on the break-even point, a condition that many industrial sectors consider manageable and healthy.
Another way of lookingat the same coin isthe Financial Autonomy Index. It is the exact opposite of the previous ratio and measures the weight of equity capital relative to all sources of financing (net assets + debt).
Formula:Financial autonomy index = Net equity / Total liabilities
How to interpret it:
This index tells you how much of the company is financed with its own funds.
A company with high financial autonomy is not only less risky, but is also viewed more favorably by banks and investors. Analyzing financial strength is not something to be done once a year, but rather something to be monitored continuously. Tracking these balance sheet ratios allows you to find the right balance between growth and risk, ensuring a stable future for your business.
Getting a number from a balance sheet formula is only half the job. Is a ROE of 15%, for example, a brilliant result or barely mediocre? The answer depends entirely on the context: the industry you work in, market dynamics, and the stage of life your company is in.
The true art of financial analysis lies not in calculation, but in interpretation. A number, taken on its own, has no strategic meaning. It only becomes valuable information when you compare it with a benchmark, whether that be the historical performance of your own company or, even better, that of your competitors.
Every sector has its own rules and balance. A manufacturing company, which has huge investments in machinery, will naturally have a lower ROI than a consulting firm, whose value is based on human capital.
Let's look at some practical examples of how reference values change:
Evaluating your indices without comparing them to industry benchmarks is like driving without knowing the speed limits: you may think you're going fast, when in reality you're the slowest on the track.
Even more important than individual annual data is its evolution over time, which we call trend analysis. A snapshot, a photo taken at a given moment, can be misleading, perhaps influenced by exceptional events. It is the trend that reveals the true direction of your management.
A ROE that drops from 12% to 10% is not a disaster, but if this decline continues for three years in a row, you have a structural problem to address. Conversely, a Current Ratio that improves steadily, rising from 1.2 to 1.8 in two years, demonstrates excellent liquidity management.
The macroeconomic context also plays a key role. Parameters such as GDP growth and inflation directly affect companies' costs and revenues. The Italian economy, for example, grew by 0.3% in the first quarter with an annual outlook of 0.8%, while core inflation stood at +1.8%, with a clear impact on consumption and operating costs. For more information on the effect of these figures, please refer to the Budget Policy Report published by the Parliamentary Budget Office.
Integrating the analysis of balance sheet ratios with sector benchmarking and trend analysis transforms a simple accounting exercise into a powerful strategic navigation tool.
We have reviewed the formulas and meanings of the most important financial ratios. But now comes the crucial point: how can you move from manual calculation—a slow, repetitive, and risky activity—to an automated process that generates strategic value?
The truth is that financial analysis done in Excel requires time, specific skills, and endless patience—resources that an SME does not always have at its disposal.
Fortunately, today it is no longer necessary to work this way. AI-based data analysis platforms, such as Electe, were created precisely to eliminate this type of manual work. The idea is simple: instead of extracting data, applying formulas, and building graphs from scratch, just connect your data sources—such as accounting software—and let the technology do the heavy lifting.
Once you have connected your sources, the process is almost instantaneous. Electe to work in the background: it processes the data, performs all the calculations, and generates interactive dashboards that present financial indicators in a clear and visually intuitive way.
With a simple click, you can switch from ROE to ROI or Current Ratio, analyzing historical trends and comparing your results with industry benchmarks.
The image below gives you an idea of how an analytics platform transforms a mountain of numbers into graphs that anyone can understand at a glance.
This visual approach allows company managers to immediately grasp key trends and focus on what those data mean for the future, instead of wasting hours collecting and calculating them.
But the real leap forward is not just automation. By leveraging artificial intelligence, these platforms can uncover hidden correlations in data and provide predictive analytics.
For example, the system could alert you that a decline in the Quick Ratio, if ignored, could turn into a liquidity crisis in the next quarter. In this regard, if you want to better understand how to structure accounting data to obtain these analyses, our guide to the company chart of accounts is an excellent starting point.
Ultimately, the benefit is clear: transforming raw data into strategic decisions in a matter of minutes, without having to hire a team of analysts. This makes financial statement analysis a dynamic management tool that is always at your fingertips, allowing even SMEs to compete on equal terms with large companies. The goal is no longer just to calculate indices, but to use them to proactively drive growth.
Mastering financial statement formulas is just the starting point. The real value, the thing that makes the difference, comes when you can turn those numbers into strategic decisions and concrete actions.
To help you do just that, here are the key points to remember:

Consider these points as a kind of mental checklist: a way to guide your financial analysis and turn theory into tangible results.
We have seen how balance sheet ratios are much more than simple mathematical exercises. They are a compass for navigating the complexities of business, offering you a clear and objective view of your company's health. From profitability (ROE, ROI) to liquidity (Current Ratio) to financial strength (Debt to Equity), each ratio tells you a fundamental part of your company's story. Remember: the real power lies not in calculation, but in interpretation and action.
Don't let your financial data go to waste. Turn it into your biggest competitive advantage. With tools like Electe, you can automate analysis, visualize trends, and gain the insights you need to make smarter decisions and drive growth for your SME.
Ready to turn your data into strategic decisions? Discover how Electe works.

.svg)
.svg)
.svg)


.png)