Learning how to read a balance sheet isn't just for accountants. It's like turning an old map into a GPS for your company's future, letting you make strategic decisions based on hard data, not just gut feelings. For many entrepreneurs, financial statements are a difficult document, a pile of tables to sign and file away. But what if, by looking at those numbers, you could see a clear story and understand where you are going and why?
This guide is designed specifically for you, the entrepreneur who wants to regain control. We won't teach you how to be an accountant, but we will teach you how to interpret the three documents that paint a complete picture of the health of your business: the Balance Sheet, Income Statement, and Cash Flow Statement.
Fortunately, today, analysis is no longer done solely with calculators and complex Excel spreadsheets. AI-powered analytics platforms, such as Electe, become your electronic eyes. Instead of drowning in incomprehensible tables, you get clear visualizations that automatically highlight anomalies, negative trends, and hidden opportunities. In this way, you transform a static document into your most powerful decision-making ally.
You don't need a degree in economics to delve into a balance sheet and understand how to read it, but rather a curiosity to decipher the story that the numbers tell.
Think of these documents not as incomprehensible tables, but as three diagnostic tools that, together, reveal the true health of your company. Each one answers a specific question, and only by putting them together will you get the full picture of the situation.
It's a bit like trying to understand a person's state of health: you would take a photograph of them, ask them how their last year has been, and take a look at their bank account. For a company, the principle is exactly the same.
This change in perspective is essential for moving from being a mere observer of data to playing a leading role in your business decisions.
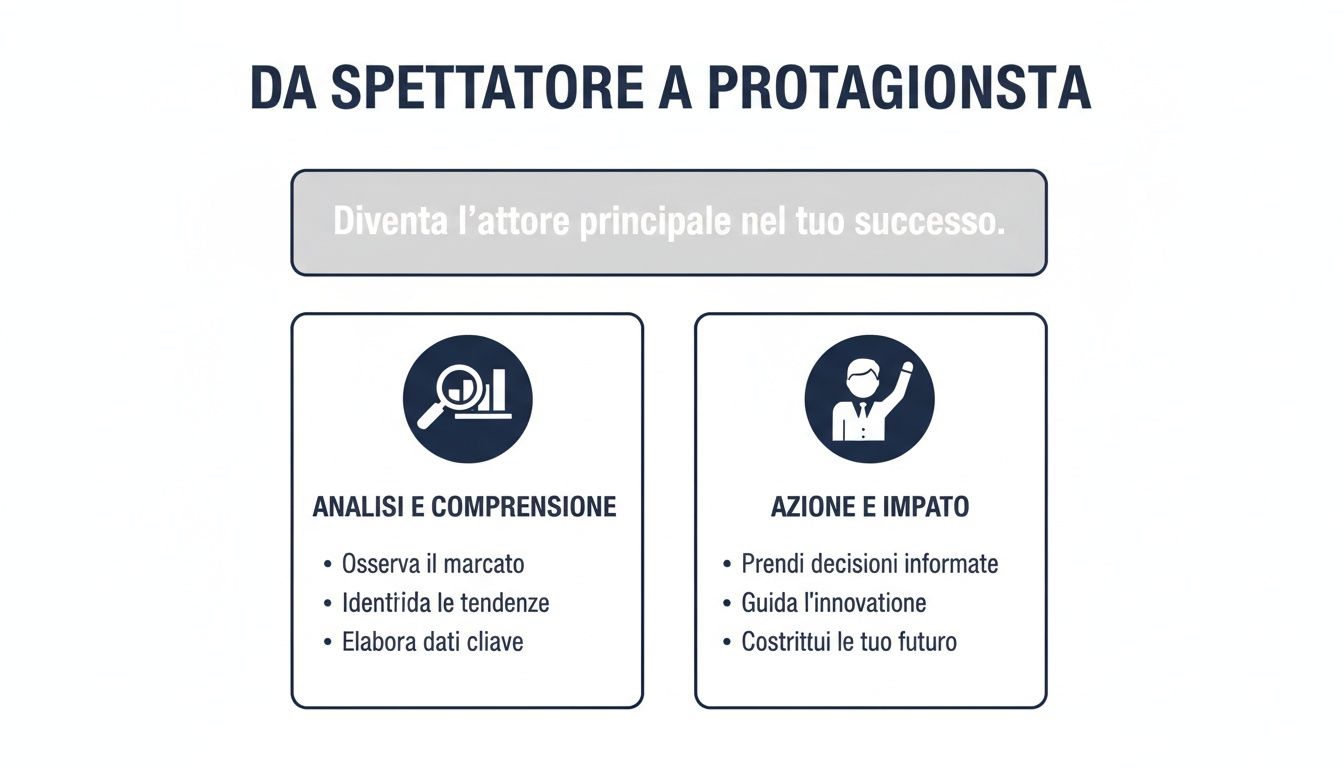
The image above sums up the concept well: you go from passively observing graphs to becoming a leader who acts on the basis of concrete analysis, building your company's success.
The balance sheet is a snapshot of the company's assets at a specific date, usually December 31. It does not tell a story over time, but answers a simple question: "At this exact moment, how solid is the company?"
Its structure is based on a perfect balance between two parts:
A positive and robust net worth is the first major sign of health. It means that your own resources exceed your debts to third parties, which is an excellent starting point.
If the balance sheet is a snapshot, the income statement is a film of the last year of activity. It recounts the performance of the management and answers the key question: "Did we make a profit or a loss?"
Its cascading structure is very intuitive. You start with sales revenue and then subtract the various costs until you arrive at the final result. The items you cannot ignore are:
The income statement not only tells you whether you are making a profit, but also how you are doing so. A growing gross operating profit, for example, is a powerful indicator of operational efficiency.
A company can have millions in profits but still go bankrupt due to a lack of cash. That's why the cash flow statement is perhaps the most important document of all for an entrepreneur. It answers a vital question: "Where did the money come from and how did we use it?"
This document tracks cash flows, dividing them into three operating areas:
Monitoring your cash flow statement protects you from the biggest trap: being rich on paper but poor in terms of cash in the bank, unable to pay salaries and suppliers.
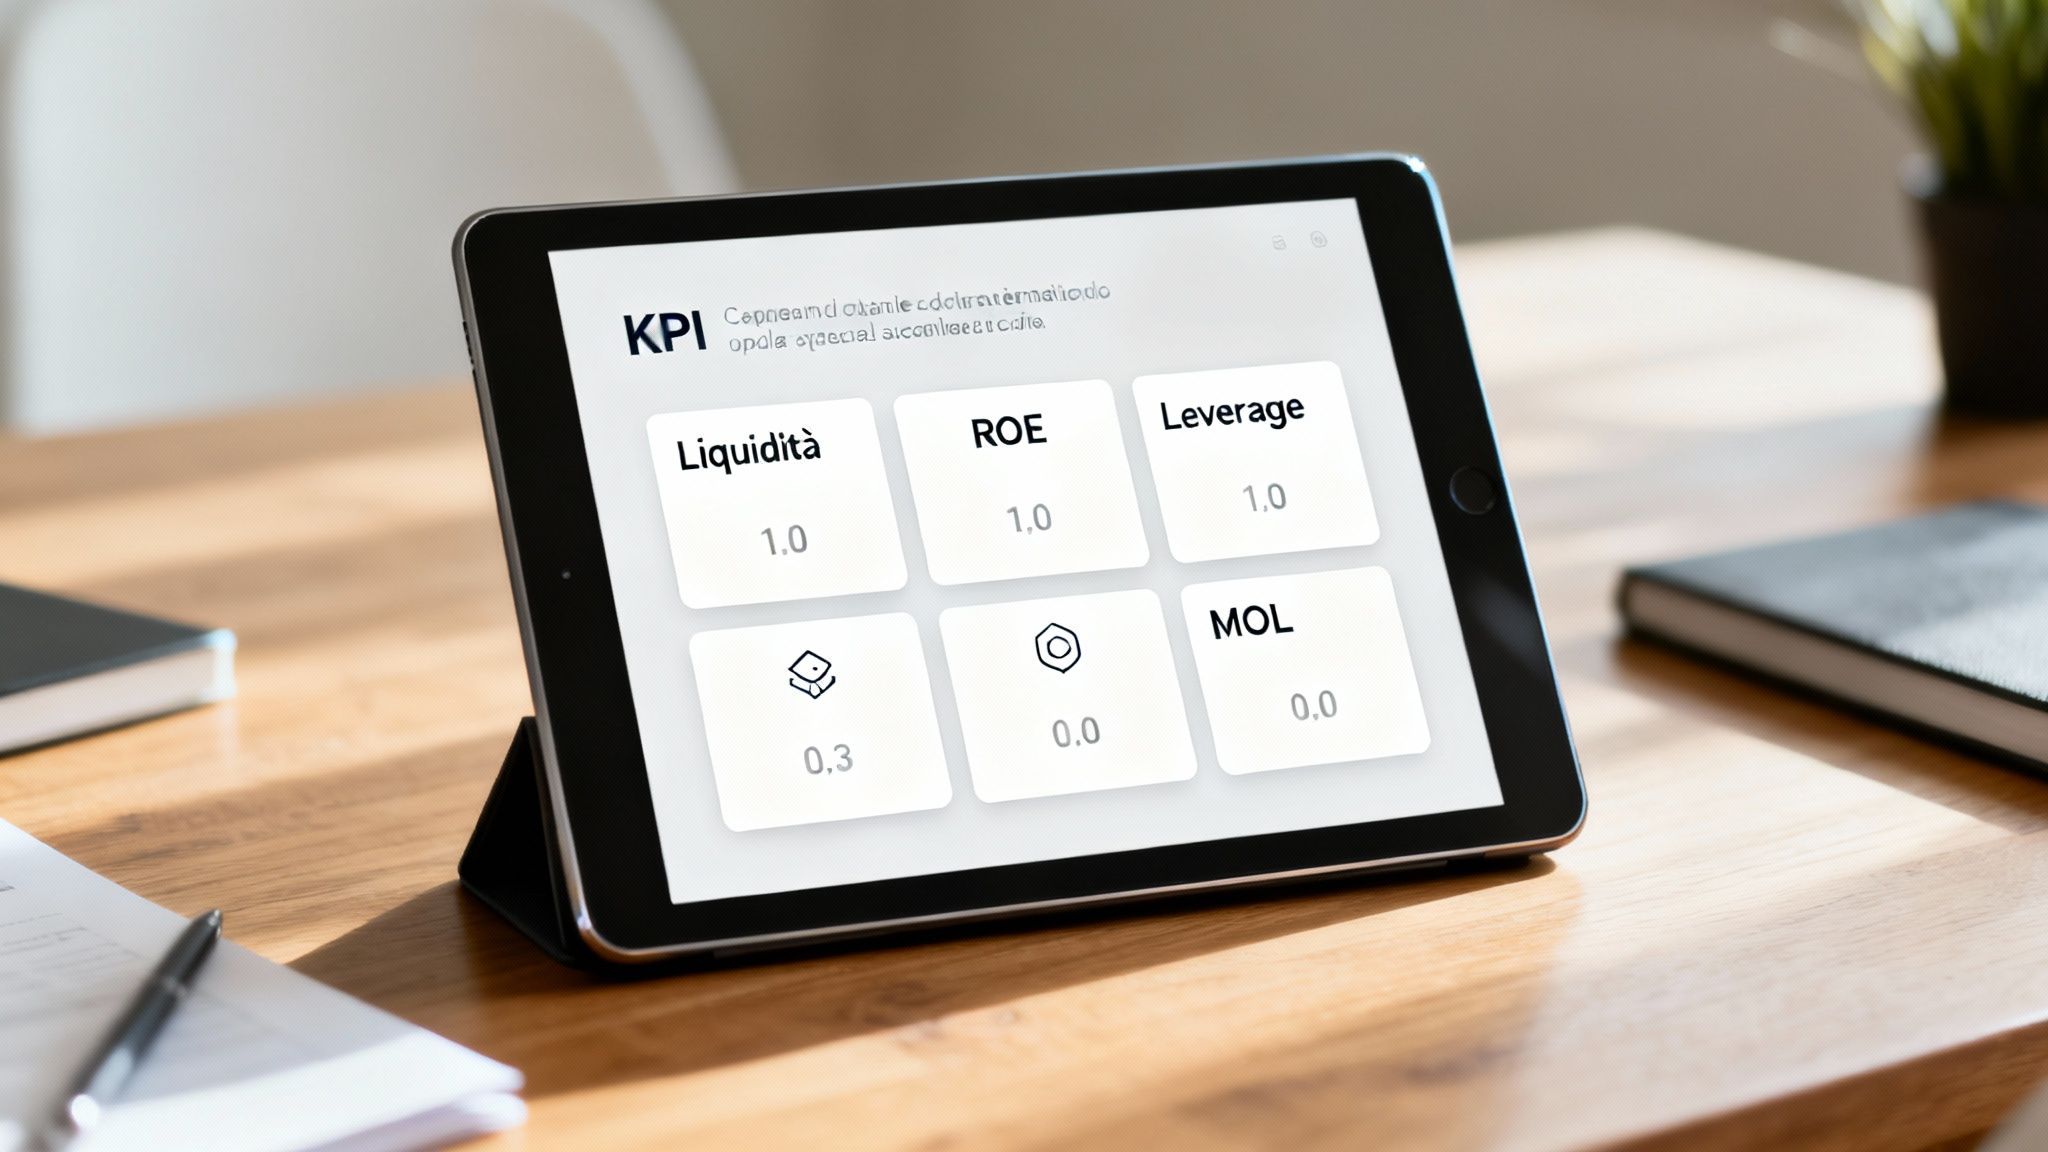
The raw figures in a balance sheet, taken on their own, tell us very little. Their true power emerges when we relate them to each other through balance sheet ratios, which are the real KPIs (Key Performance Indicators) capable of transforming figures into strategic vision.
Think of these indicators as your car's dashboard: you don't need to be a mechanic to drive, but you need a speedometer, fuel gauge, and temperature gauge to know where you're going and whether you can get there safely.
Instead of getting lost in dozens of complex formulas, we will focus on a small group of essential indicators. These are the ones that every SME entrepreneur should always keep an eye on to get a feel for how their company is doing.
Liquidity is the lifeblood of a company. You can have the best products and record profits, but if you don't have the cash to pay salaries and suppliers, the game is over very quickly. The key indicator for monitoring liquidity is the current ratio.
This index answers a question that is as simple as it is vital: "With the resources I have in the short term, can I cover my debts that are due soon?"
Let's look at a practical example. If you have Current Assets of €200,000 and Current Liabilities of €100,000, your Current Ratio is 2. Great, you're in a solid position. But what if the opposite were true? A result of 0.5 would mean that for every euro of debt due, you only have 50 cents of resources available. This is a situation of severe financial stress.
Making a profit is the goal, but it is even more important to understand how effectively your company is generating that profit. This is where two "twin" but profoundly different indices come into play: ROI and ROE.
Rendimento dell'investimento (ROI)
ROI is the barometer of operational management. It measures the profitability of total capital invested, without looking at how it was financed (with own funds or debt). It is the key indicator of efficiency.
Return on Equity (ROE)
ROE, on the other hand, looks at things from the shareholders' point of view. It measures how much return they get on the capital they have invested directly in the company. It is the indicator most closely watched by anyone interested in investing in your company.
Knowing how to read a balance sheet through ROI and ROE allows you to separate the efficiency of the operating machine (ROI) from the profitability for those who put money into it (ROE). A company could have an excellent ROI but a low ROE if, for example, it is crushed by interest expenses.
How dependent are you on banks? The leverage index answers this very question by measuring your level of indebtedness.
A company with a leverage ratio of 3, for example, is financing three-quarters of its business with debt and only one-quarter with its own funds. This is not necessarily a bad thing if profitability is high (this is the "leverage" effect), but it exposes the company to much greater risks in the event of difficulties.
These indices are not just numbers for experts, but tools for strategic dialogue. They are the language you use with banks, potential investors, or your team to define objectives. Analyzing them constantly is essential. A recent study of nearly 600,000 Italian financial statements, for example, shows that in 2023, operating income per employee grewby 8.9%, reaching €19,958. This suggests an increase in operational efficiency at the national level, a benchmark you can compare yourself to, as detailed in the complete data from the Study of the financial statements of corporations.
AI-based platforms such as Electe automate the calculation and monitoring of these KPIs, transforming static data into visual and dynamic dashboards. This frees you from manual work and allows you to focus on what really matters: interpreting signals and making decisions.
A balance sheet, on its own, is a snapshot. A snapshot taken at a specific moment in time which, however detailed, remains static. True strategic vision, the kind that allows you to anticipate moves and control the future, does not come from a single snapshot, but from comparing multiple balance sheets over time.
This is where we move from photography to film: dynamic analysis. You no longer look at a single frame, but reconstruct the complete story of your company.
Take a key indicator, such as ROE. Is a value of 10% good? On its own, it's an almost abstract number. But if you know that the previous year it was 5%, then that 10% becomes an extraordinary success, a doubling of profitability for your shareholders. If, on the other hand, it was 15% the year before, that 10% becomes a warning sign, a signal that requires immediate investigation.
To understand how to read a financial statement effectively, you need to put the numbers into perspective. Comparing data from the last three, or better still five, years reveals patterns, trajectories, and reversals that would otherwise remain invisible.
It is precisely in this comparative analysis that weak signals, both positive and negative, are hidden.
Trend analysis allows you to see problems before they become full-blown crises. It's not about finding someone to blame, but rather a way to identify areas of risk that require your attention.
Here are some signs you can spot by comparing financial statements:
Recognizing these trends gives you time to act. You can renegotiate terms with suppliers, optimize inventory, or review credit policies before the situation becomes critical.
Of course, dynamic analysis isn't just about finding problems. It's a powerful tool for uncovering opportunities for growth and optimization that you can capitalize on.
You may discover, for example:
Analyzing financial statements also provides valuable context for interpreting macroeconomic data. For example, a Bank of Italy survey revealed that 78% of Italian companies ended the last financial year in profit. Knowing this helps you compare your performance with the national average, as you can see in the complete statistics on the business survey.
Manually comparing years of data can be a lengthy and tricky process. This is where artificial intelligence changes the game. An analytics platform like Electe than Electe calculate indices and display them in a graph.
It goes much, much further. It uses algorithms to:
This approach transforms analysis from reactive (understanding what happened) to predictive (anticipating what might happen). For those who want to learn more about how technology can analyze large volumes of historical data, our guide on Big Data Analytics offers valuable insights.
Ultimately, learning to read trends transforms the balance sheet from a mandatory document into a strategic compass. It allows you to guide the company by looking ahead, not just in the rearview mirror.
Let's clarify one point right away: analyzing financial statements the old-fashioned way, with spreadsheets and data entered manually, is a task that requires time, expertise, and a considerable amount of patience. For an SME entrepreneur, spending hours combing through dozens of accounting entries to find useful information is a luxury that few can afford.
Today, however, artificial intelligence is rewriting the rules of the game. Financial analysis is becoming accessible, immediate, and infinitely more powerful. We are no longer just talking about calculating indices, but about having a real virtual advisor at our side who transforms complex tables into visual insights.
The first, huge step forward that AI-powered platforms such as Electe bring to the table is automation. Forget exporting CSV files and copying and pasting into complex Excel templates. The system connects directly to your sources—whether it's your management or accounting software—and acquires data automatically and continuously.
This isn't just a time saver. It almost completely eliminates the risk of human error, which can compromise the validity of your spreadsheets. Free up your energy from repetitive tasks so you can focus on what really matters: interpreting the results and deciding what to do next.
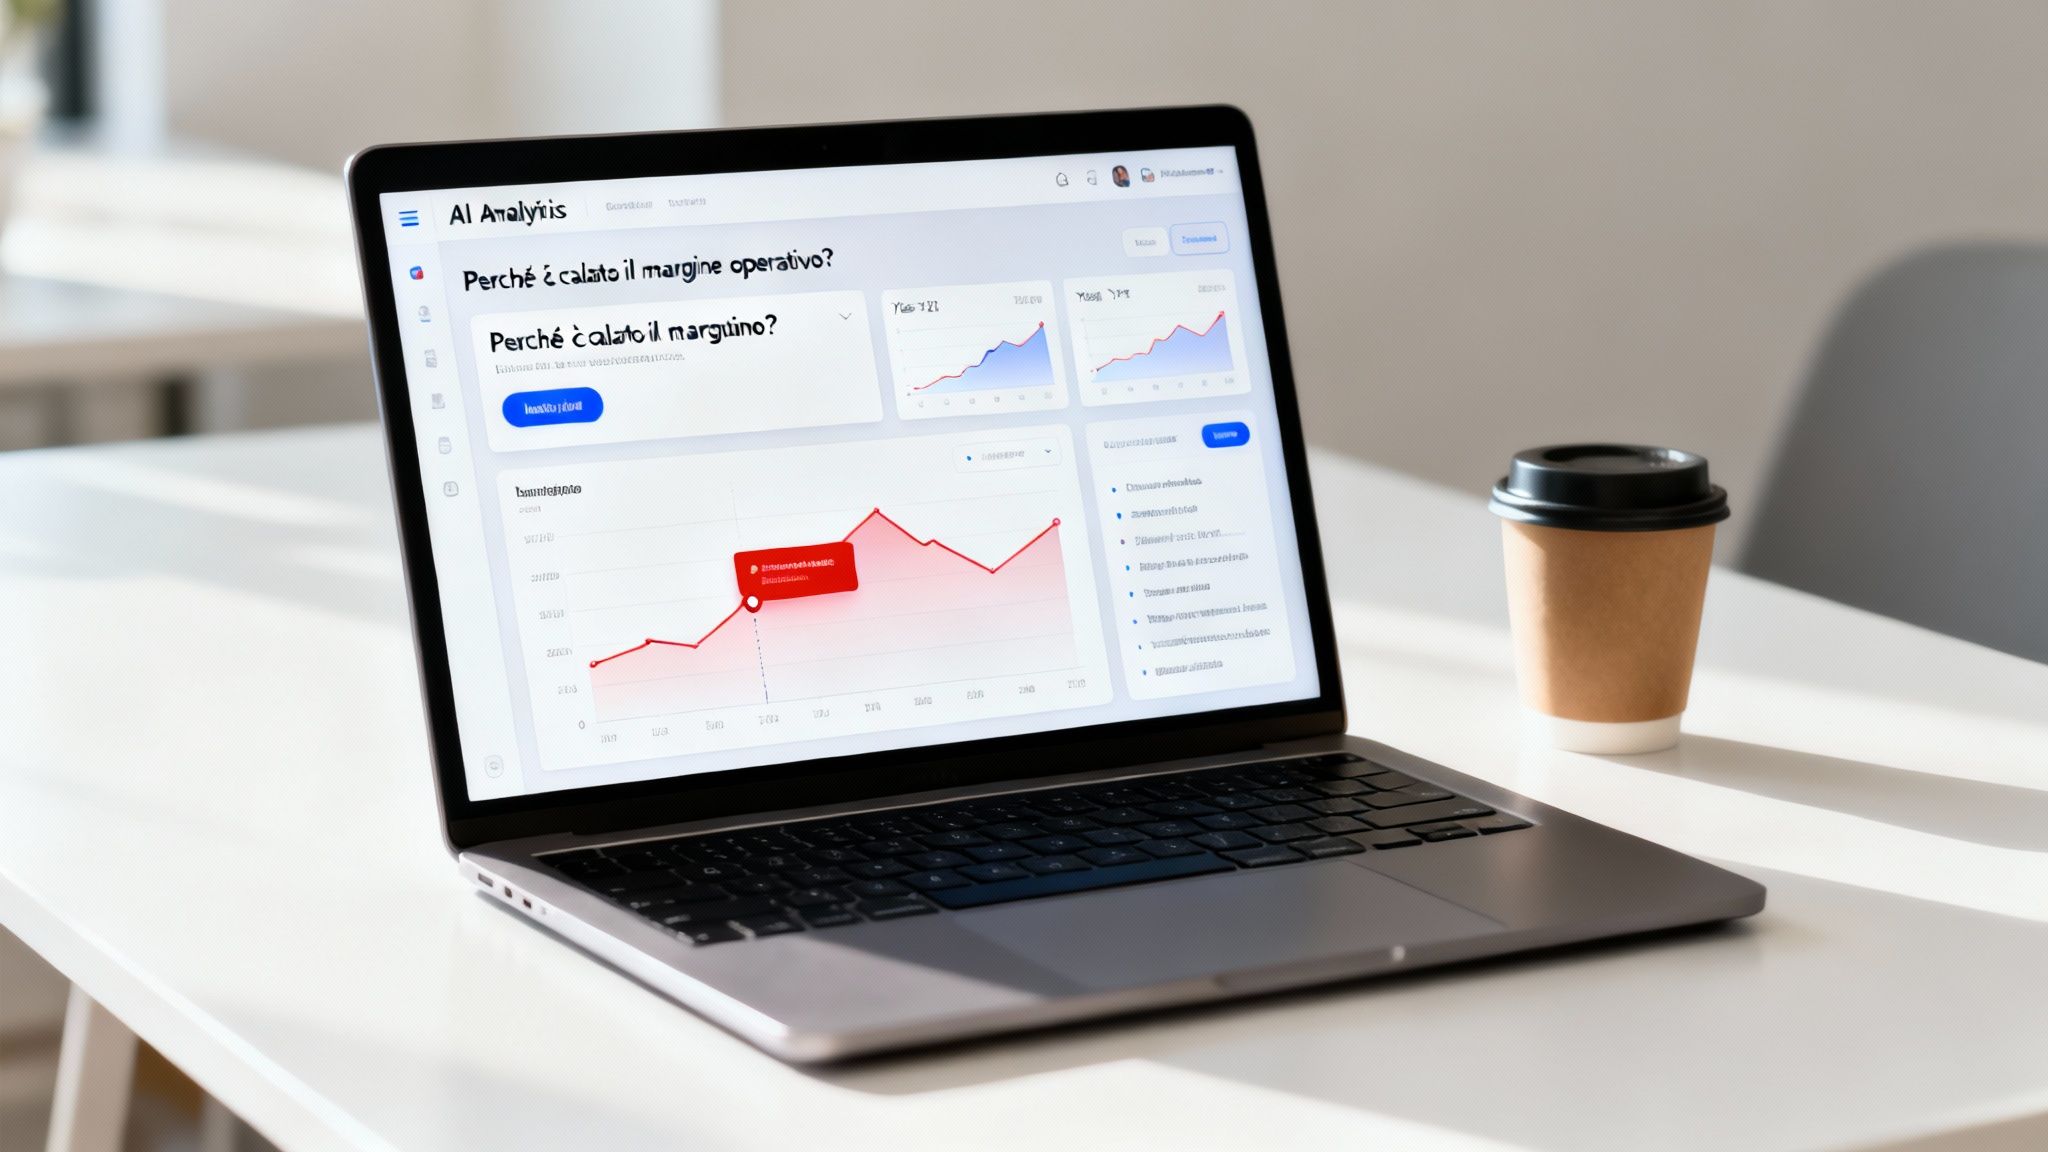
Our brains process images 60,000 times faster than text. AI does exactly that: it transforms those endless rows of numbers into graphs, interactive dashboards, and visual stories. A drop in operating margin is no longer an anonymous figure in a table, but a red curve pointing downward that immediately catches your attention.
Understanding becomes instantaneous. You can navigate through data, filter by period or business line, and see correlations with a simple click, without having to become a pivot table wizard.
But the real magic of AI isn't just showing what happened. It's anticipating what might happen. Traditional analysis stops at calculating yesterday's indices. Machine learning algorithms, on the other hand, study historical data series, learn to recognize patterns, and project them into the future.
With AI, financial statement analysis goes from being a rearview mirror to a headlight that illuminates the road ahead. You don't just see the problem when it's already arrived, you anticipate it.
This translates into very concrete advantages:
The final frontier is conversational analytics. Imagine being able to simply ask, as you would a colleague, "Show me why the margin on product X has fallen this quarter." The AI platform doesn't just give you a number. It analyzes the variables—costs, sales volumes, discounts applied—and presents you with a graph that isolates the root cause.
This approach is democratizing access to data. You no longer need to be a financial analyst to ask complex questions. If you want to learn more, we discussed the role of modern AI-driven decision support systems.
Having AI tools to navigate growth is no longer an option, but a decisive competitive advantage.
You have reached the end of this journey. By now, it should be clear to you that financial statements are not something to be feared, but rather your most valuable strategic advisor. Knowing how to read financial statements means transforming a legal obligation into a powerful lever for growth. Here are three key actions you can take right away:
Leading your SME to success does not require a degree in economics. It requires the willingness to interpret its financial history and the right tools to write its future. Transforming complex data into clear decisions is the real leap forward for an entrepreneur.
Data analytics platforms such as Electe were created precisely for this purpose: they automate analysis, uncover predictive insights, and enable you to make data-driven decisions with a confidence you've never had before. Instead of reacting to problems, you start anticipating them.
Ready to illuminate your company's future with artificial intelligence? Discover how Electe help you make better decisions.

.svg)
.svg)
.svg)