Does your team work hard, but the results aren't always what you hoped for? Small mistakes, delays, and inefficiencies may seem like isolated problems, but when added together, they erode margins and customer satisfaction. Many companies focus on quality control of the finished product, only intervening when the damage is done. But what if you could anticipate problems before they happen?
True quality control in the workplace is a proactive approach that monitors the health of your processes in real time. It's not about supervising people, but about optimizing the system in which they operate, making their work smoother, more efficient, and more rewarding. With the help of artificial intelligence, this approach is no longer a luxury for large corporations, but a strategic lever accessible to any SME ready to grow.
In this guide, we will show you how to implement a data-driven quality control system for your work. You will discover practical methodologies, essential KPIs for monitoring performance, and how analytics platforms such as Electe, an AI-powered data analytics platform, make this process automated and intuitive, transforming your data into better decisions.
Quality isn't just about what you sell, but how you produce, manage, and improve it. Effective quality control transforms the entire organization, shifting the focus from simply correcting errors to preventing them. It's a change in mindset that transforms quality from a cost center to a growth engine.
This approach is now more crucial than ever. The National Statistical Program 2023-2025, with its project "The quality of work in Italy," aims to measure aspects such as working hours, safety, and internal climate, highlighting the urgent need to move from quantitative to qualitative control, as detailed in the official Sistan report.
Implementing a data-driven quality control system brings tangible benefits:
Thinking about quality control only at the end of the process is like hiring an auditor after the money has run out. True quality is built step by step, not just checked at the end.
The good news? Today, you don't need a team of data scientists to do this. Innovative tools make data analysis accessible, allowing you to transform information into concrete actions for sustainable growth.
Implementing a work quality control system does not mean adopting a rigid, one-size-fits-all solution. There are several proven approaches that you can adapt to the specific needs of your company, transforming them from theoretical concepts into practical tools. The goal is to give you a compass for choosing the method that delivers concrete results without adding unnecessary complexity.
Let's explore three of the most effective approaches, from the simplest to the most structured.
The Deming Cycle, known as PDCA (Plan-Do-Check-Act), is the ideal starting point for any company. It is a simple, iterative model that consists of four stages:
Its strength lies in its simplicity: no major investments are needed, just the willingness to experiment and measure, promoting a culture of continuous improvement.
If your goal is near-absolute precision, Six Sigma is the way to go. This method uses rigorous statistical analysis to find and eliminate the causes of defects, with the goal of achieving a maximum of 3.4 defects per million opportunities.
Consider e-commerce order management: one mistake can lead to returns, dissatisfied customers, and unexpected costs.
Adopting an approach such as Six Sigma means moving from a "hope for the best" mentality to a data-driven culture, where every decision is supported by numerical evidence.
It is a more intensive method than PDCA, but for high-impact processes it is a very powerful tool.
While traditional quality control identifies defects in the finished product, Quality Assurance (QA) focuses on prevention. The underlying idea is simple: if the process is well designed from the outset, the end result will be of high quality.
QA is responsible for defining clear standards and procedures for each activity. An example? Creating a detailed operating manual for customer service. By defining in advance how to handle each request, you ensure a consistent standard and reduce the likelihood of errors. To map and optimize your workflows, check out our guide to business process management.
There is no "best" methodology, only the one that best suits your goal. PDCA is great for getting started, Six Sigma for refining vital processes, and QA for building solid foundations.
Without data, every decision is just an opinion. For effective quality control of your work, you need to rely on precise metrics: Key Performance Indicators (KPIs). It's not about accumulating random data, but choosing those key indicators that tell you the real story of your company, without drowning you in a sea of information.
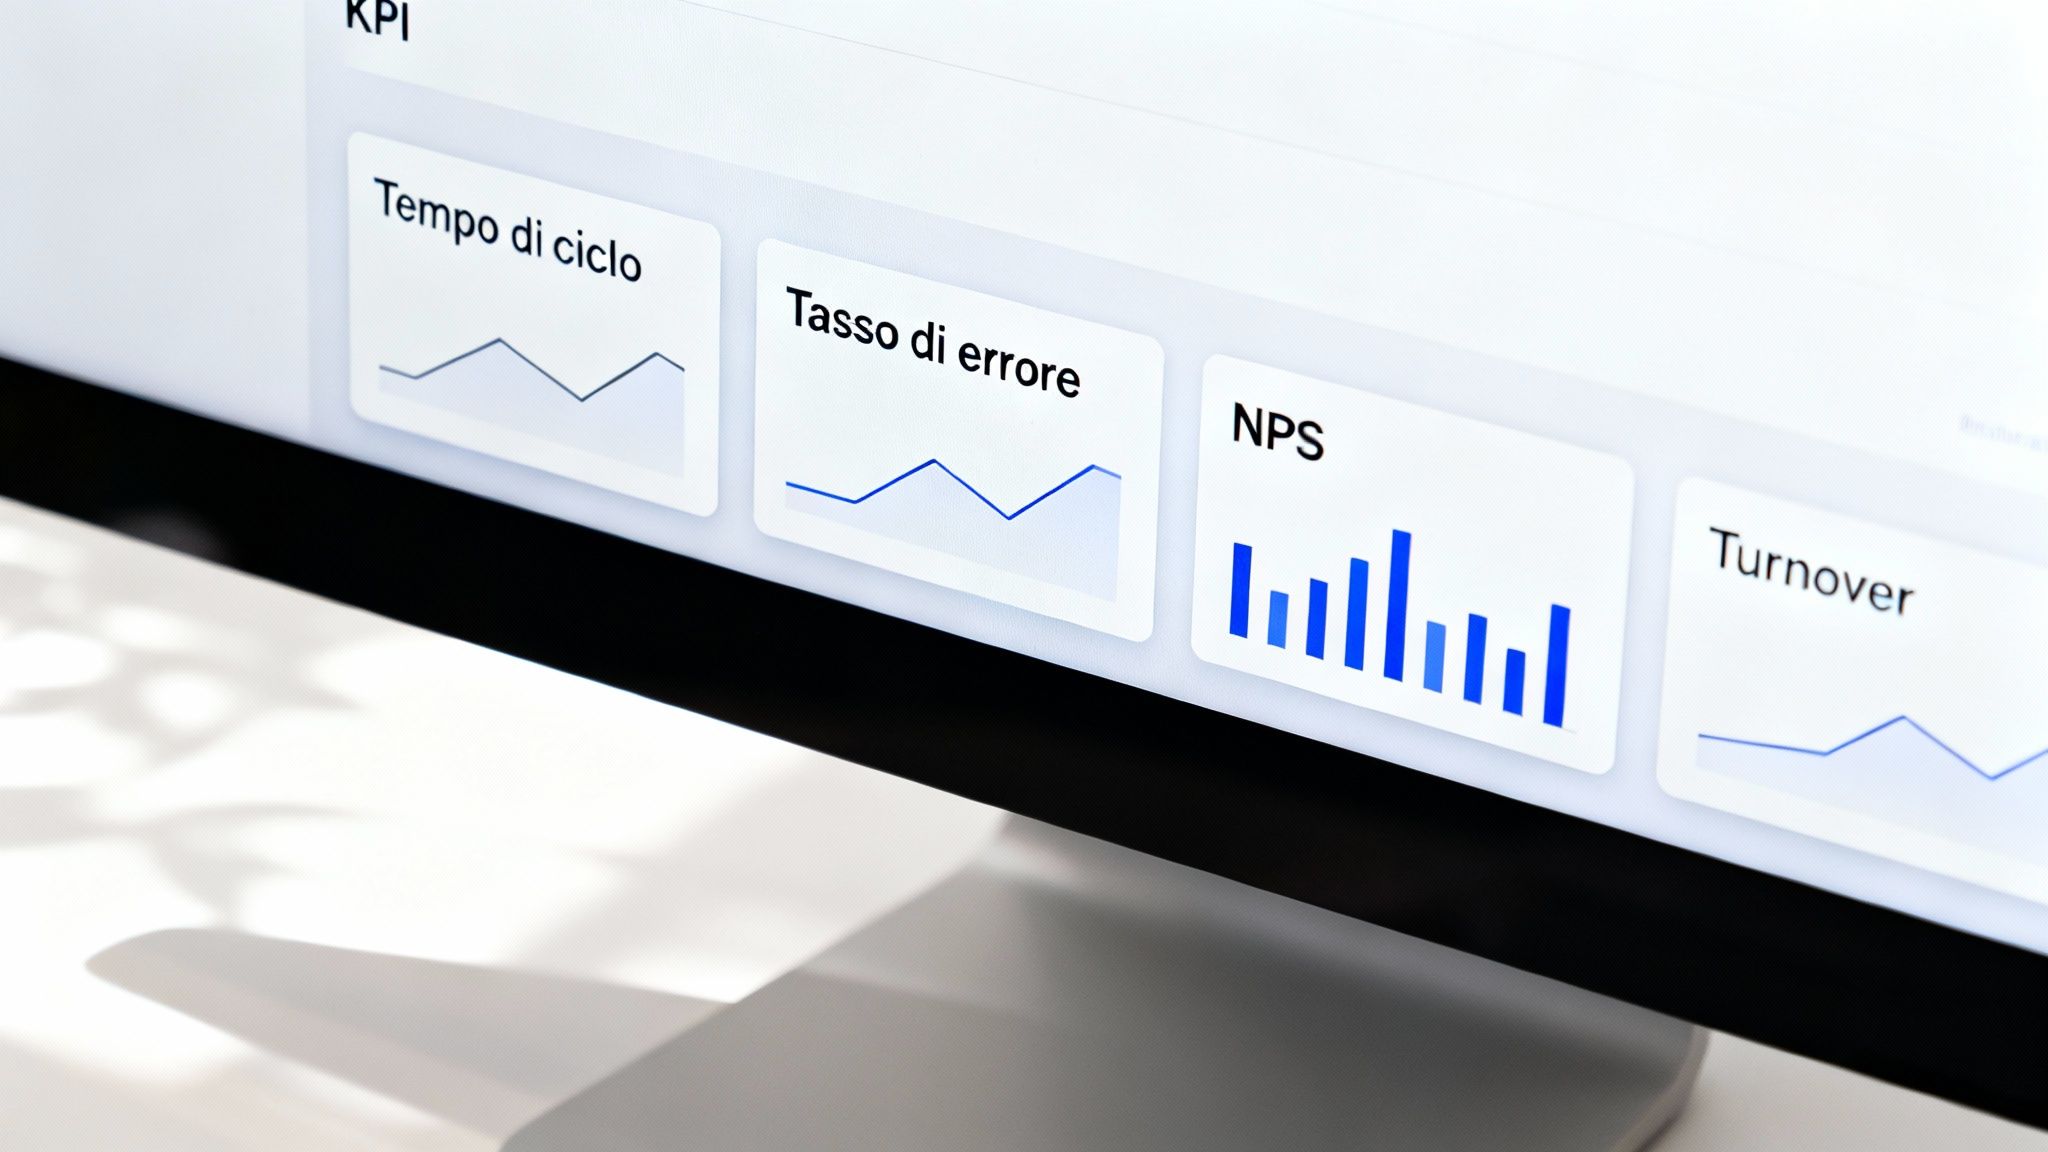
We group KPIs into three key areas to give you a clear and functional overview.
These KPIs measure the health of your internal processes, i.e., how well you are transforming resources (time, materials, people) into results.
Your processes may be efficient, but if the end customer is unhappy, there is a problem. These KPIs measure the impact of your work on the outside world.
A comprehensive quality control process cannot ignore people. A motivated, competent, and stable team is the true foundation of any successful process.
A demotivated or stressed team is the primary cause of a decline in quality. Monitoring organizational well-being is not a "soft" activity, but a direct investment in the stability and efficiency of your processes.
Here are some key KPIs:
Putting this data together may seem complex, but technology makes all the difference. To learn more about how modern platforms transform data into strategic insights, read our article on business intelligence software. Electe automatically Electe these metrics into intuitive dashboards, giving you a clear, real-time view that allows you to take action before small problems become crises.
Artificial intelligence is changing the rules of quality control. Forget the reactive approach that detects an error when it's too late. Now you can switch to a predictive model that anticipates errors. Imagine a system that doesn't just tell you "there's a problem," but warns you before it happens.
AI never tires, never gets distracted, and can analyze volumes of data that would overwhelm any team. It becomes a tireless guardian of your processes, working behind the scenes to ensure that everything runs smoothly.
Machine learning algorithms are designed to learn from your data. They analyze continuous streams of information from every corner of your business—from e-commerce logs to sensors on a production line—to uncover hidden patterns and deviations from the norm.
These anomalies are often weak signals, precursors to larger problems:
The contrast between a traditional approach and one based on AI is stark. Manual checks are like taking a snapshot of a process every now and then: they give you a static, delayed view based on samples that may miss the problem.
A real-time, AI-powered quality dashboard, on the other hand, is like a continuous, high-definition video of your operations. It gives you constant visibility that allows you to take immediate action, turning small, manageable problems into avoided major crises.
Artificial intelligence transforms quality control from a retrospective inspection to constant, proactive supervision. It is no longer a question of finding defects, but of creating an environment in which defects struggle to arise.
Adopting AI tools for quality control is a cultural shift that makes your organization more agile. For those who want to get started, our roadmap for AI integration offers a practical action plan.
Unioncamere's forecasts for 2025-2029 indicate strong demand for quality assurance specialists, highlighting the link between digital transformation and quality, as evidenced in Unioncamere's forecast analyses. Electe, our AI-powered data analytics platform, is designed for this: it connects your data sources and uses AI to transform raw numbers into actionable insights.
Implementing a quality control system at work does not have to be a Herculean task. With a structured approach and the right tools, even an SME can build an effective system without disrupting the organization.
Here is a five-step plan.
Before measuring, you need to know what to measure. Focus on the critical processes that have the greatest impact on your business. If you have an e-commerce business, the order fulfillment process is vital. For an agency, it could be the onboarding of a new client. Draw a simple flowchart to visualize each step and understand where the risks lie.
Once you have mapped the process, establish what "quality" means in that context. Define clear and measurable standards using Key Performance Indicators (KPIs). For e-commerce, your standards might be: "ship all orders within 24 hours" and "picking error rate below 1%." The corresponding KPIs become average fulfillment time and percentage of incorrect orders.
Defining KPIs is not an exercise in style. It is the way you translate your business goals into a language that data can speak and that your team can use as a compass.
Quality data is almost always fragmented across CRM, management systems, and spreadsheets. Leaving them separate is like trying to complete a puzzle by looking at one piece at a time. The third step is to connect these sources to get an overview. Platforms such as Electe integrate with the tools you already use, aggregating information in one place without manual operations.
This diagram shows the logical flow: starting with raw data and arriving at strategic decisions through AI analysis.
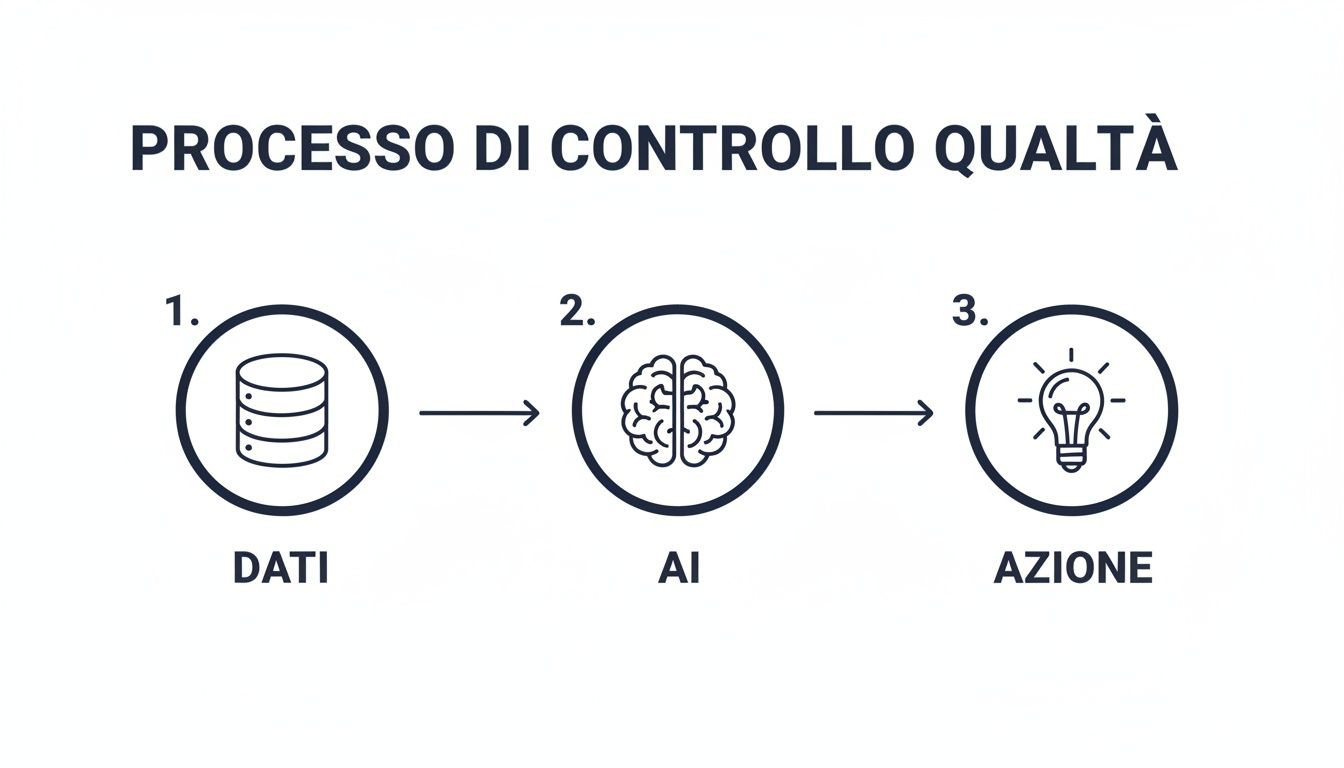
Artificial intelligence acts as a bridge, analyzing collected data to generate insights that drive concrete improvement actions.
With your data consolidated, it's time to put it to work. A platform like Electe information into intuitive dashboards. In an instant, you can view your KPIs in real time, spot a trend (such as a gradual increase in delivery times), or identify an anomaly. Visualizing data makes it understandable to everyone, promoting a culture of accountability and transparency.
The final step closes the circle. The insights you gain from your analyses must be turned into concrete actions. Does the dashboard show a spike in complaints? You can investigate immediately. Do you notice a slowdown at certain times of day? You can reorganize shifts. Every action generates new data, fueling a cycle of continuous improvement that, once started, never stops.
Theory is fundamental, but it is real-life stories that demonstrate the value of data-driven quality control in the workplace. Let's see how this approach translates into concrete results in different sectors.
For those who sell online, the order fulfillment process is at the heart of everything.
In the world of finance, quality is a legal requirement.
A structured approach to quality is not just an internal matter. It becomes a driver of competitiveness that can make an entire region attractive and enhance its ability to retain the best talent.
This link has been confirmed: a survey on quality of life in Italian provinces has shown that the best-performing areas also excel in terms of labor market quality, as you can read in more detail in the analysis by ItaliaOggi.
Every defective piece is a waste of raw materials, time, and energy.
Approaching quality control in the workplace can raise doubts, especially for SMEs. Let's clarify with practical answers.
Start small but with a clear goal. Choose a single vital process (e.g., order management) and identify one or two simple KPIs to measure (e.g., "average fulfillment time"). Focusing on a limited area allows you to see quick results without heavy investment, creating internal success that can be replicated.
Absolutely. Quality control applies to any process that produces a physical good or service. You can measure quality in the management of support tickets, the efficiency of the billing cycle, or customer satisfaction after a consultation. The goal remains the same: to identify inefficiencies and improve the final output.
The key is transparent communication. Explain that the goal is not to grade people, but to improve the system in which everyone works.
Quality control does not seek to blame individuals, but rather to identify the causes of problems. When the team understands that analyzing data serves to remove obstacles and make work flow more smoothly, it becomes your greatest ally.
Present it as a tool to make everyone's work less frustrating. Involve people in choosing KPIs: their experience in the field is a gold mine.
Process visibility is almost instantaneous: from the moment you connect your data to a platform such as Electe, you start seeing your KPIs in real time. Operational improvements (error reduction, cycle times) can take anywhere from a few weeks to a few months. Real cultural changes take longer, but they are the most solid and profitable.
The path to effective quality control begins with a first step. Electe is the AI-powered platform that helps you turn data into better decisions.

.svg)
.svg)
.svg)