Focusing solely on revenue is like driving while looking only at the speedometer. It tells you how fast you’re going, of course, but it doesn’t reveal whether you have enough fuel, if your tire pressure is correct, or if the engine is at risk of overheating.Analyzing financial ratios, on the other hand, is your company’s comprehensive dashboard: the tool that allows you to read the story that the numbers alone don’t tell.

The real turning point for an entrepreneur comes when financial data ceases to be a mere formality and transforms into strategic insights. This is precisely the essence of ratio analysis: finding answers to those crucial questions that determine a company’s future, from sustainability to growth.
This guide isn’t a list of formulas to memorize. It’s designed for you—an entrepreneur or SME manager—who wants to look beyond the raw data to truly understand what those numbers mean and make better decisions today.
The goal is simple: to gain a clear picture, from various angles, of your company’s health. In practice, by using these metrics, you can finally answer questions such as:
A well-done financial analysis is not just a stylistic exercise for an accountant. It is the bridge that connects past data to future strategies, the tool that transforms the complexity of numbers into clear decision-making.
Along the way, we will see how data analytics platforms such as Electe are finally making this type of analysis accessible to every SME. By automating calculations and displaying trends with intuitive charts, they transform a task that was once complex and costly into a dynamic, everyday management tool.
This approach puts you in a position to anticipate problems, seize opportunities as they arise, and lead your company with much greater confidence. To do all this, however, there is one essential prerequisite: starting with well-structured data. That’s why a properly designed chart of accounts isn’t just a minor detail, but the very foundation of any financial analysis that aims to be reliable.

To turn a simplefinancial statement into a strategic compass,the analysis of financial ratios must be organized. Instead of getting lost in a sea of formulas, it is much more effective to group the indicators into four broad categories that, together, tell the complete and authentic story of your company.
Think of these areas as a patient’s vital signs: each measures a different aspect of health, but only by looking at the big picture can you make an accurate diagnosis. These four areas are: liquidity, solvency, profitability, and efficiency.
This is the most immediate question—and, very often, the most critical one—for an SME. Liquidity ratios measure your company’s ability to meet its short-term financial obligations. Put simply: Can you pay salaries, suppliers, and taxes without any trouble?
Well-managed liquidity isn't just a safety net; it's the freedom to seize opportunities without having to scramble for outside financing.
Solvency ratios, or equity ratios, examine the balance between sources of financing. In practice, they help you understand the extent to which your company relies on debt (borrowed capital) compared to the extent to which it is financed by you and your partners (equity).
The key indicator here is leverage (or debt-to-equity ratio), which is calculated as Total Liabilities / Shareholders' Equity. A high value indicates a heavy reliance on borrowing, increasing financial risk, especially in an environment of rising interest rates.
There is no single "right" figure; it all depends on the industry and the stage of your company's development.
A rapidly growing company could use leverage strategically to accelerate its growth, but a mature company with excessive leverage might be seen as financially fragile. The point is that debt must be sustainable, not a dead weight.
This is the area that, understandably, interests entrepreneurs and investors the most. Profitability ratios measure your company’s ability to generate profits. It’s not enough to simply generate a lot of revenue; what matters is that that revenue is converted into profit.
The key indicators to watch are:
In a competitive market, maintaining strong profitability is an ongoing challenge, but it is the litmus test of your business model’s viability. The resilience of Italian businesses is remarkable: the National Association of Accountants’ Financial Statement Observatory revealed that, out of nearly 600,000 financial statements, the share of profitable companies rose to 87%, with peaks of 91.4% among small businesses. You can explore the data from this analysis further by reading the full report on the health of corporations.
Finally, efficiency (or turnover) ratios measure your ability to manage operational resources, such as inventory or accounts receivable. Optimizing these areas can free up cash and directly improve profitability.
A key example isthe Inventory Turnover Ratio (Cost of Goods Sold / Average Inventory). A high ratio indicates that you are selling your inventory quickly, thereby reducing storage costs and the risk of it becoming obsolete. For a manufacturing company, improving this single metric can have a direct and significant impact on cash flow.
To give you an overview, here is a summary table that lists the metrics we’ve discussed, organized by area of analysis. It’s an excellent reference to keep on hand.
In terms of liquidity, the Current Ratio is calculated by dividing Current Assets by Current Liabilities and measures the ability to cover short-term debts with liquid assets within one year. The Quick Ratio (or Acid-Test Ratio) refines this analysis by subtracting Inventory from Current Assets before dividing by Current Liabilities: it is a stricter test of liquidity, which excludes inventory as it is less liquid.
In the area of financial strength, the leverage ratio is calculated by dividing total liabilities by shareholders' equity and indicates the extent to which the company relies on debt relative to its own capital.
In the profitability section, we find three ratios. ROE (Return on Equity) divides Net Income by Shareholders’ Equity and measures the return generated for every euro invested by shareholders. ROI (Return on Investment) divides Operating Profit (EBIT) by Capital Invested and assesses the efficiency with which the company uses its total capital to generate operating profit. ROS (Return on Sales), on the other hand, divides Operating Profit (EBIT) by Revenue and indicates the percentage of revenue that is converted into profit, before taxes and interest.
In terms ofefficiency, inventory turnover is calculated by dividing cost of goods sold by average inventory, and it measures how quickly a company sells its inventory: the higher the figure, the better.
This table isn't just a list of formulas—it's a comprehensive checklist for your company's health. Use it as a starting point to identify where action is needed and which areas require the most attention.
A financial ratio, on its own, is essentially a meaningless number. It’s like a single frame from a movie: it shows you a specific moment, but it doesn’t tell the whole story. Its true potential only becomes apparent when you put it into context, when you compare it to other data. That’s when financial analysis stops being a mathematical exercise and becomes a powerful tool for guiding strategic decisions.
To truly understand what ROE, ROI, and the current ratio are telling you, you need to view them through two key lenses: time and the market. Only then will you discover not only "where you are now," but also "how you got there" and "where you're headed" relative to everyone else.
The first level of analysis—the most straightforward one—is the historical analysis. It simply involves lining up your company’s key performance indicators from the last three, or better yet, five years, and seeing which direction they’ve taken. Are they improving? Worsening? Or have they remained flat?
This historical analysis allows you to identify trends, understand the real impact of past decisions, and, most importantly, anticipate problems before they become emergencies. It’s your financial logbook.
There is no such thing as an "ideal" value for a ratio. High debt can be a strategic lever for a rapidly growing company that is investing to gain market share, but a warning sign for a mature company in a stable industry. Context is everything.
The second level, which is just as crucial, is competitive benchmarking. Simply put: how are your competitors and the industry average faring? This analysis is the only way to gain a truly objective view of your performance.
Imagine you have a ROS (Return on Sales) of 5%. At first glance, that might seem like a decent result. But if you then discover that the industry average is 10%, the picture changes completely. Suddenly, that 5% is no longer a success, but a sign that your competitors are better than you at controlling costs or maintaining selling prices.
This type of comparison helps you:
Keeping an eye on these figures is vital. According to a recent analysis, the financial health of Italian companies, though fragile, is becoming more stable: the average debt-to-equity ratio has fallen to 65% from 72%. This figure underscores how crucial it is to understand your position relative to the market. To learn more about this trend, you can consult the full analysis of corporate financial health.
By combining historical analysis with benchmarking, you’ll no longer just have numbers—you’ll have a true three-dimensional map of your company’s health, ready to guide your next steps.
Having the right numbers in front of you is just the first step.Analyzing financial ratios is not a theoretical exercise to be tucked away in a drawer. On the contrary, it is the starting point for taking action.
Those numbers, trends, and comparisons with the competition only become truly valuable when you turn them into concrete decisions that can genuinely improve your company’s trajectory. That’s when analysis turns into action.
So what do you do when you discover that a metric isn’t where it should be? Every insight must lead to an operational action. The goal isn’t just to diagnose the problem, but to prescribe an effective and timely solution.
Identifying an anomaly in a metric is a bit like seeing a warning light come on in your car’s dashboard: it’s not enough to know there’s a problem—you have to take action. If the oil pressure is low, you pull over and top it off. Similarly, every metric must be linked to a specific set of corrective actions.
Let's look at a few practical examples that illustrate this point well.
The real skill isn't in calculating the ratio, but in knowing which operational, commercial, or financial lever to pull to adjust it. Financial statement analysis shows you where to look, but it's your business experience that guides you on how to act.
A well-conducted analysis becomes an incredibly powerful tool at every stage of a company’s life cycle. It can be the deciding factor in convincing a bank to grant you a loan, the key data point for validating a new investment plan, or the warning sign that prompts you to halt an overly risky acquisition.
In short, analyzing financial ratios is the foundation of a more informed and strategic decision-making process. If you’d like to learn more about this topic, check out our guide on how to make data-driven decisions.
Calculating dozens of metrics by hand in spreadsheets isn’t just a slow and tedious process. It’s also dangerously prone to errors. All it takes is one wrong formula or a single data entry mistake to throw an entire analysis off track, leading you to make decisions based on distorted information. This approach—which is frankly outdated—wastes precious hours that you could be spending on activities that truly add value, such as developing a strategy or talking to customers.
Today, artificial intelligence has completely changed the game. Advanced financial analysis is no longer a luxury reserved for large multinational corporations, but a powerful tool within the reach of every SME. Electe, our AI-powered data analytics platform, was created precisely for this purpose: to makethe analysis of financial ratios a democratic, dynamic, and proactive process.
The workflow—from raw data to strategic decisions—finally becomes simple and intuitive.
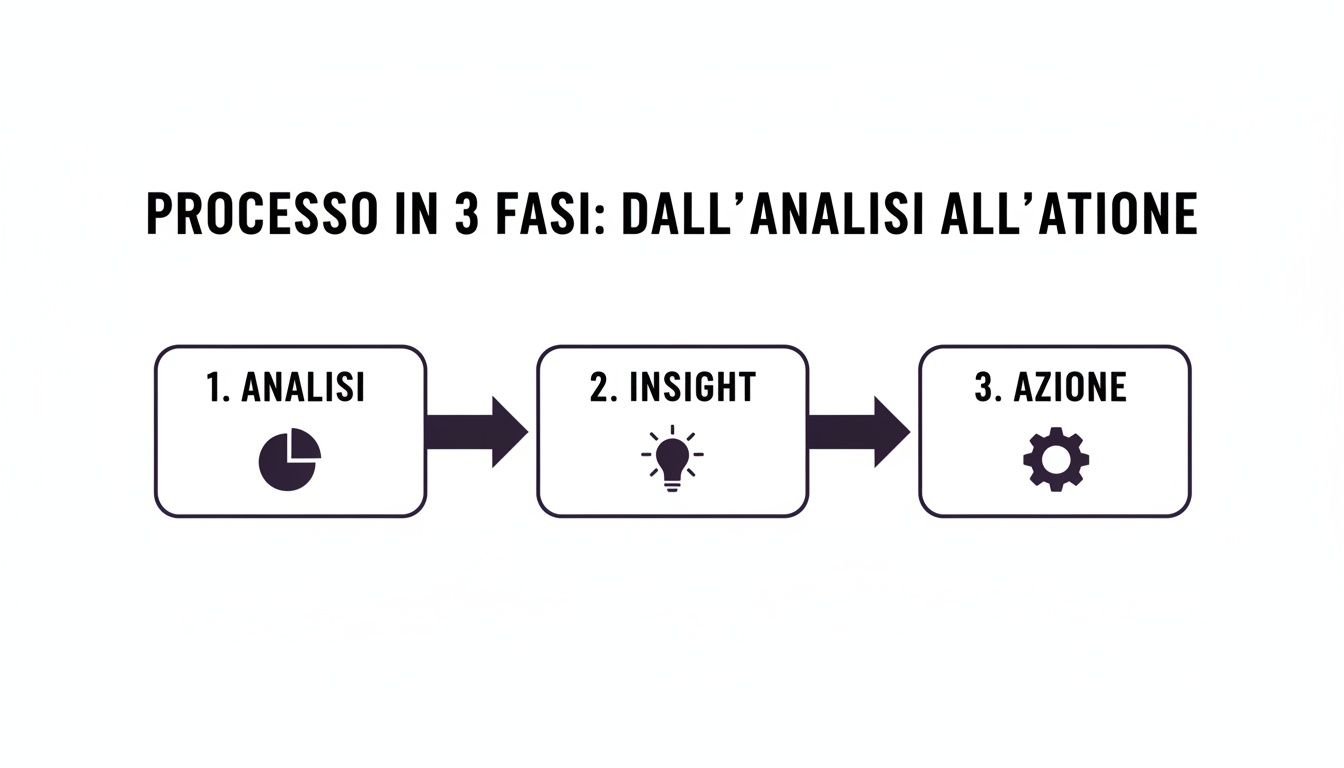
This diagram shows exactly how AI turns data into concrete actions. It automates the tedious parts of analysis to reveal clear insights that guide your operational decisions.
Imagine being able to connect your accounting systems to a platform that, in just a few minutes, does all the heavy lifting for you. Electe with your data sources, extracts the information you need, and automatically calculates dozens of financial KPIs, updating them in real time.
The result isn't a confusing spreadsheet, but a series of visual and intuitive dashboards. You can track trends in ROE, current ratio, or inventory turnover using interactive charts, comparing current results with previous periods or industry benchmarks.
The benefits for you are clear right from the start:
True evolution isn’t about switching from spreadsheets to software, but about changing your mindset: from static, periodic analysis to dynamic, continuous monitoring of your company’s financial health.
Imagine a manager who receives an automatic alert on their smartphone because the liquidity ratio has fallen below the safety threshold. This notification allows them to take immediate action—perhaps by holding a non-urgent payment or expediting a collection—before the situation turns into an emergency.
This is the power of AI-powered financial analysis. It’s no longer just about looking in the rearview mirror to understand what happened, but about having a smart navigation system that helps you choose the best path forward. If you want to learn more about the potential of these tools, check out our guide to Business Intelligence software and discover how they can transform the way you work.
Here, we’ve compiled some of the most common questions that entrepreneurs and SME managers face when they start using financial ratios. The answers are straightforward, practical, and designed to give you actionable insights you can apply right away.
The right answer depends on the index and what you're trying to achieve. To get a strategic overview, a quarterly analysis is an excellent starting point, usually aligned with the end of the fiscal quarter.
But be careful: for critical indicators like liquidity ratios (the Current Ratio, for example) or for keeping an eye on customer payment cycles, waiting three months is too long. A monthly check is a must. This way, you can spot any financial strain right away, before it turns into a serious problem. Platforms like Electe, in fact, go beyond this fixed-schedule approach, giving you a near-real-time snapshot of the situation so you can act at the first sign of an anomaly.
Without a point of comparison, numbers don't mean much. To find reliable benchmark data, the traditional sources are:
The most straightforward option today is to use a data analytics platform such as Electe. In fact, these systems often already integrate aggregated industry data directly into their dashboards. This allows you to compare your performance instantly and visually, without having to waste time searching for and importing data from different sources.
The number one mistake—and the most serious one—is to look at just one metric at a time. A company’s health is like a puzzle: you need to understand it by seeing how the various indicators fit together. A very high ROE may seem like a success, but if it’s inflated by excessive debt, it’s actually hiding a huge risk.
Another common mistake is ignoring the context. A 5% ROI can be excellent in a low-margin industry, but a disaster in another. You must always take into account the market and the economic cycle in which you operate.
Finally, there is a more insidious risk: basing strategic decisions on outdated data or, worse yet, data that has been miscalculated in a spreadsheet. Automation isn’t just a convenience—it’s an insurance policy against these errors, ensuring that your decisions are always based on up-to-date and reliable information.
Are you ready to turn your financial figures into strategic decisions? With Electe, you can automate financial ratio analysis, view trends in real time, and compare your performance against the market—all on one intuitive platform.

.svg)
.svg)
.svg)